Selected Results

-
Satellite AOD Evaluation
 PMAp2 Evaluation: EUMETSAT ITT 15/210839

- EUMETSAT ITT 15/210839 Final Acceptance Review (FAR) presentation:
About the Validation of the Polar Multi-Sensor Aerosol product (PMAp)
- EUMETSAT ITT 15/210839: PMAp2 product validation report (21/12/2016):
Comparison of Metop - PMAp Version 2 AOD Products using Model Data
- EUMETSAT Report:
Polar Multi-Sensor Aerosol Product Validation Report
Validation and verification of the PMAp2 AOD product

Figure 3a: Image of the Meteorological Operational (MetOp) spacecraft (ESA, EADS).
Short Summary The European Organisation for the Exploitation of Meteorological Satellites (EUMETSAT) has released in January 2016 the Polar Multi-sensor Aerosol product version 2.1 (PMAp2).
The PMAp2 inversion algorithm retrieves the aerosol optical depth (AOD), aerosol type (e.g., volcanic ash, dust) and cloud properties over the ocean and land using a multi-sensor approach. The algorithm uses the Polarization Monitoring Devices (PMD) from the instrument of the Global Ozone Monitoring Experiment-2 (GOME-2) in combination with data from other instruments of the Meteorological Operational (MetOp) satellites, in particular of the Advanced Very High Resolution Radiometer (AVHRR) and of the Infrared Atmospheric Sounding Interferometer (IASI). Compared to the pre-operational PMAp product, PMAp2 provides an extended set of aerosol and cloud properties, which include AOD over land and an improved volcanic ash retrieval combining AVHRR and IASI. PMAp has been first delivered in January 2014 for GOME-2. GOME is an optical spectrometer on the MetOp satellites GOME-2 Newsletter(38).
The MetOp program launched a series of three satellites sequentially over an observational period of 14 years. MetOp-A is Europe's first polar, low Earth orbit (LEO) spacecraft launched on 19 October 2006, while Metop-B was launched on 17 September 2012. Recently, Metop-C was launched on 7 November 2018 in an even lower polar orbit at an altitude of 817 kilometres, to provide more detailed observations of the global atmosphere, oceans and continents. The three satellites will operate in unison for as long as Metop-A's available capacities bring benefits to users.
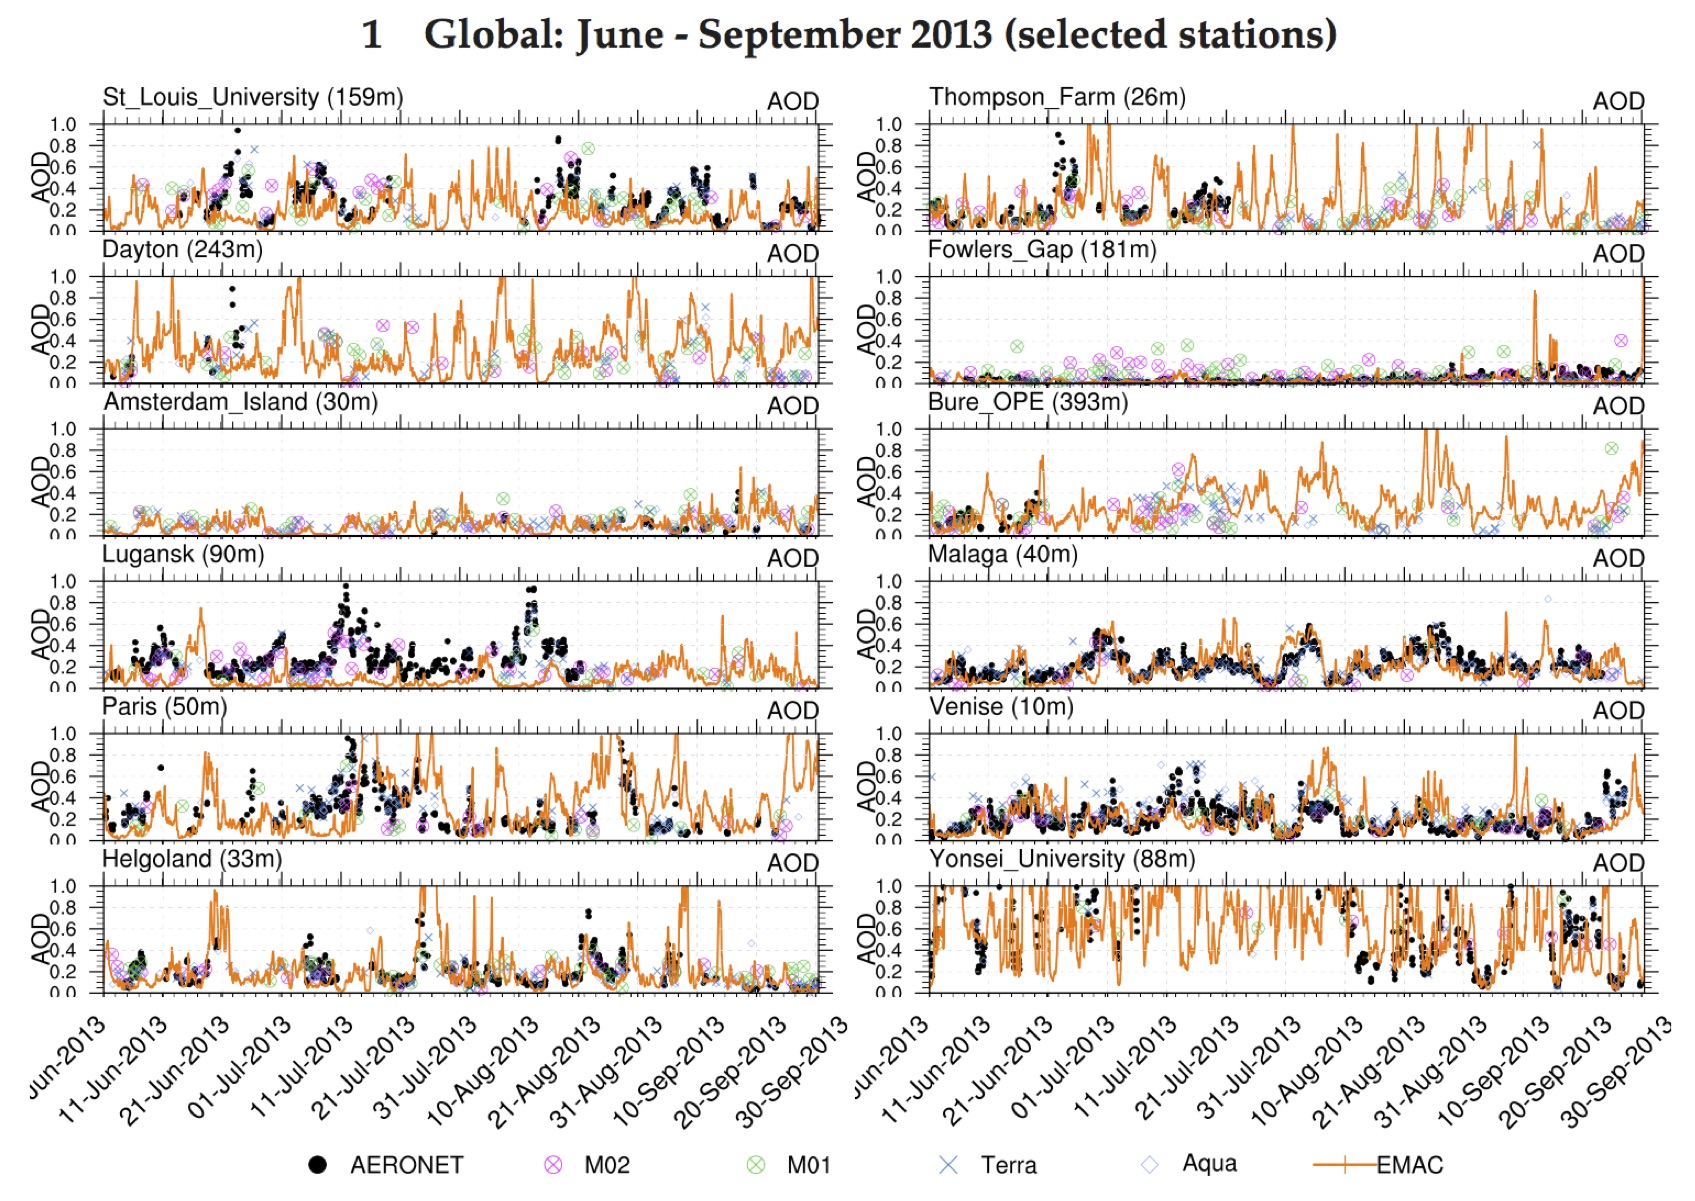
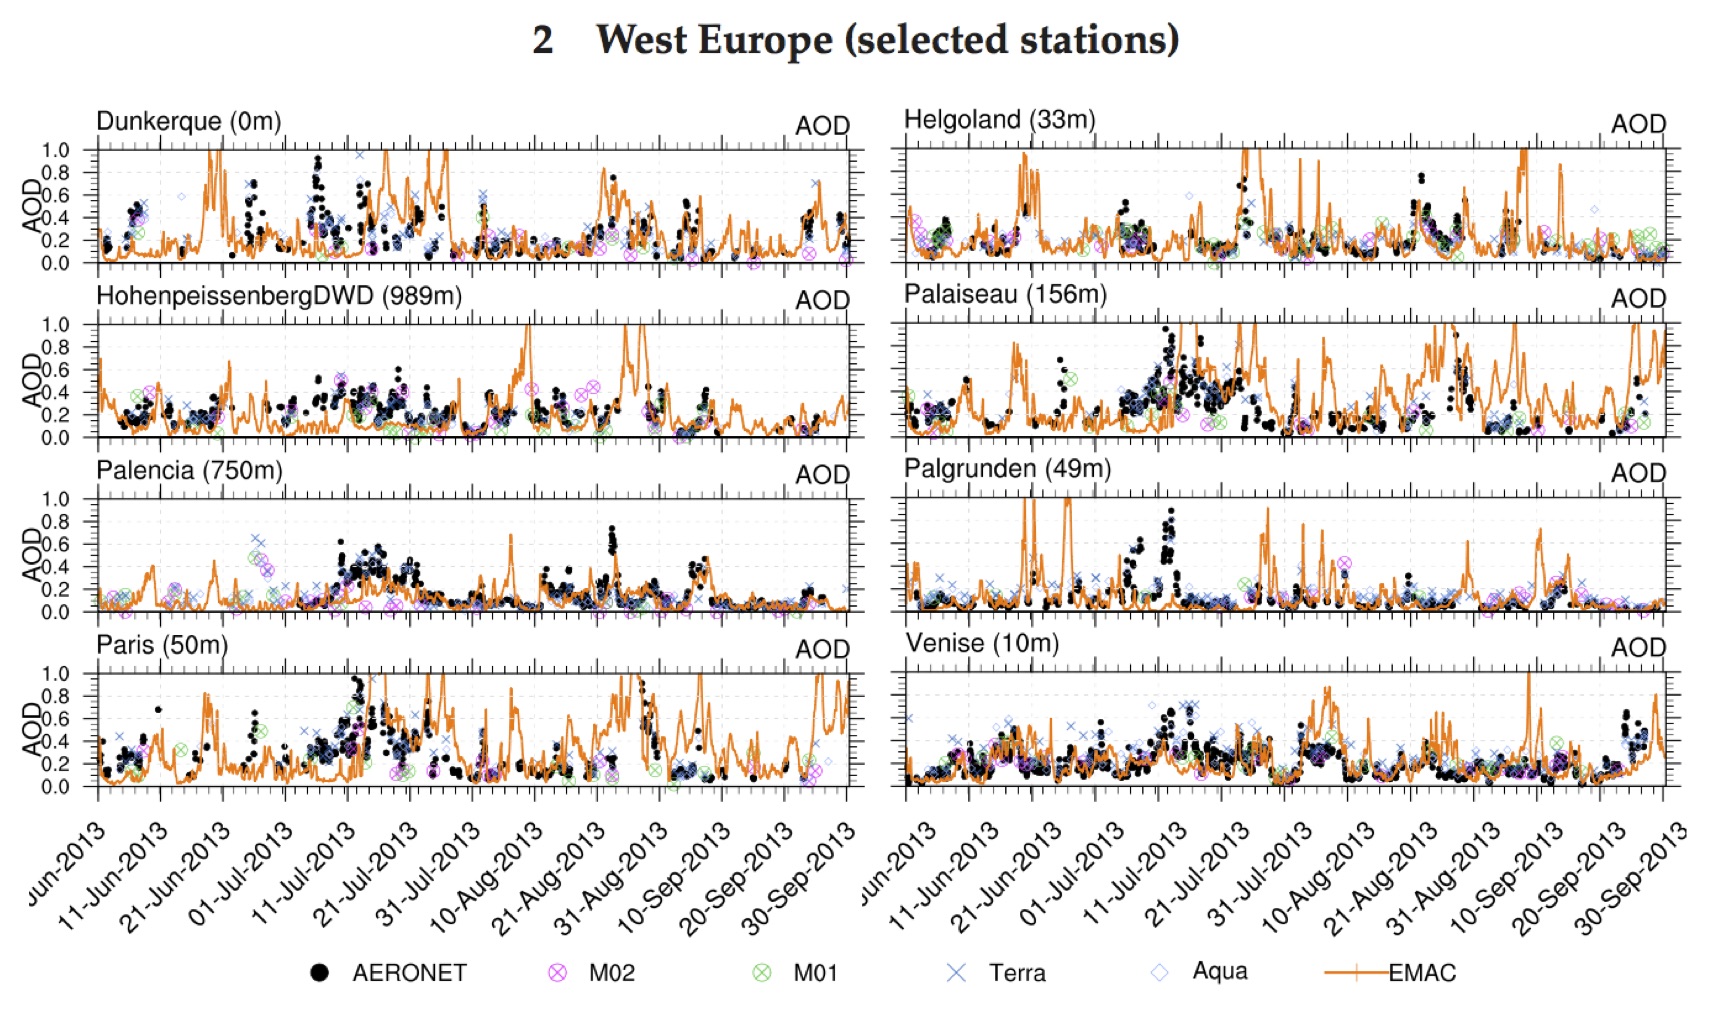
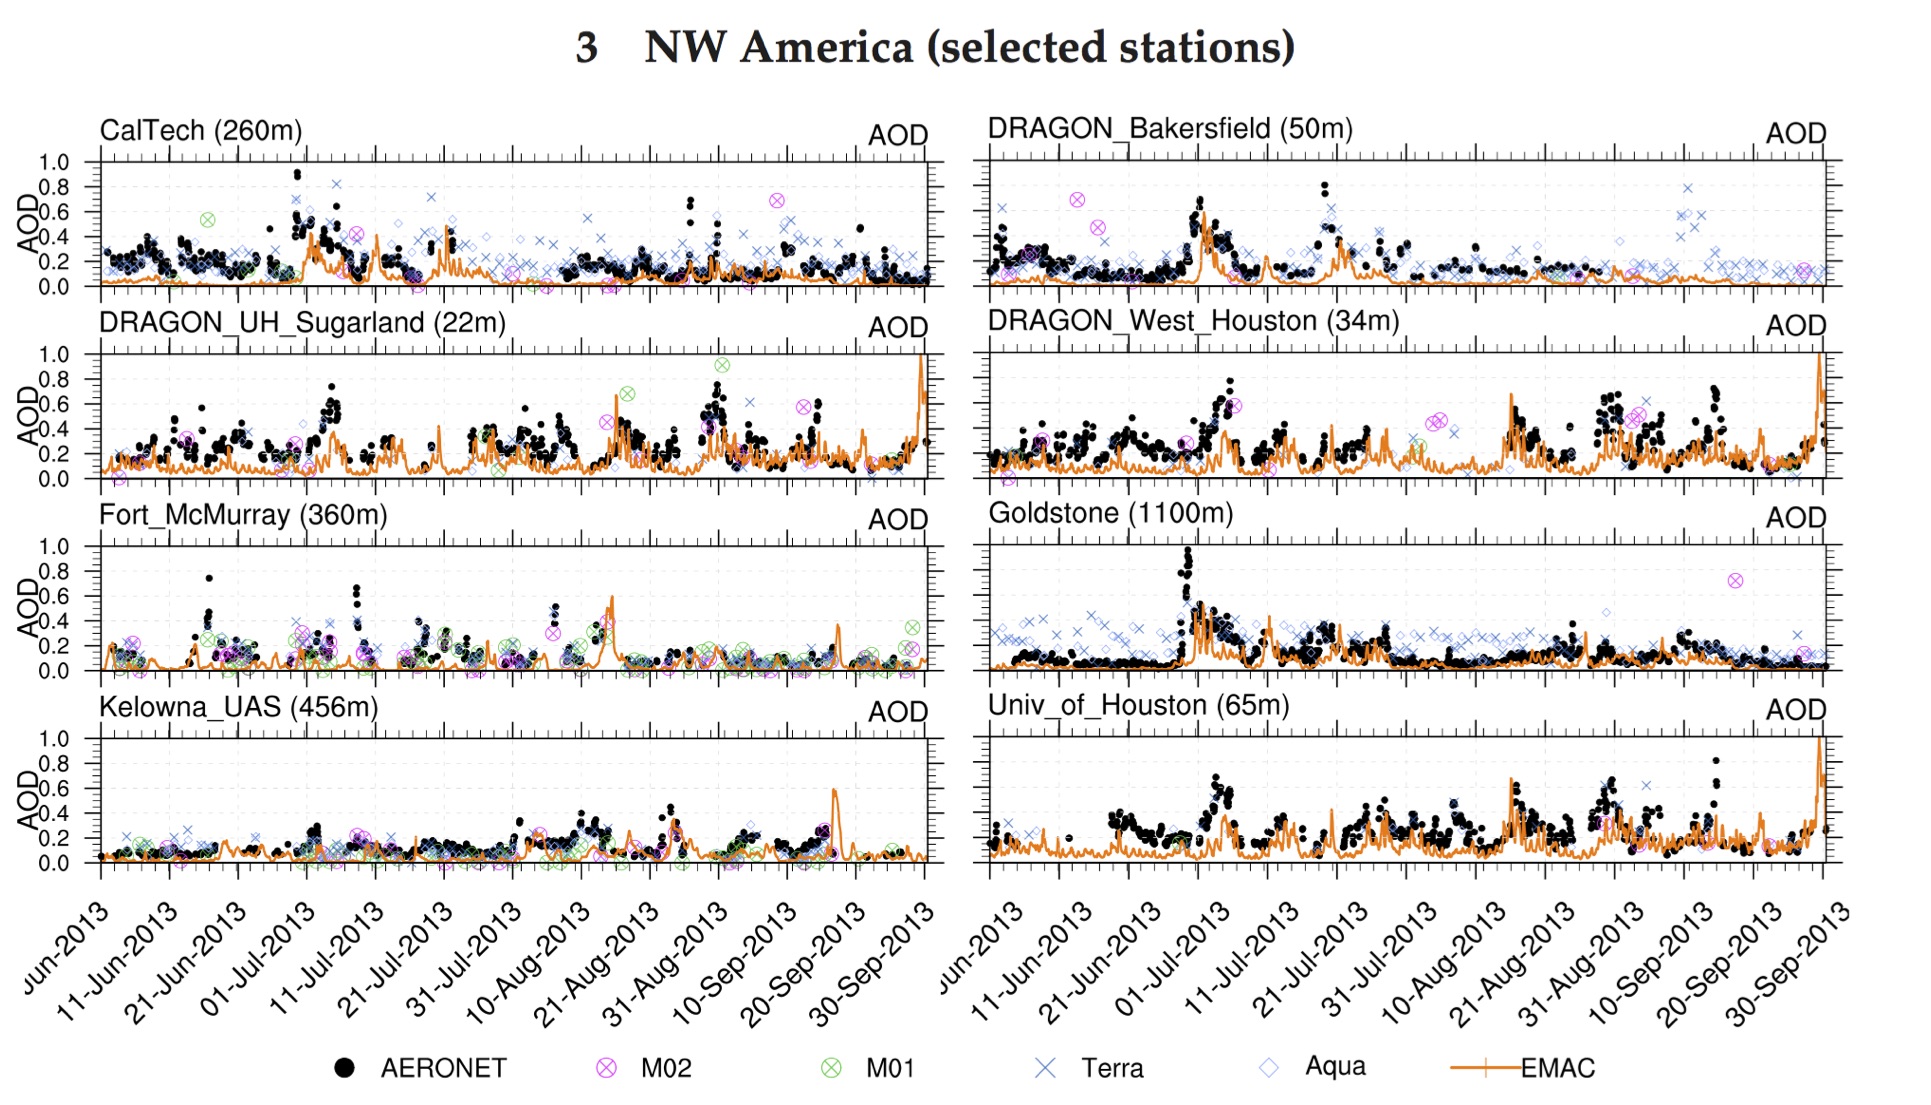
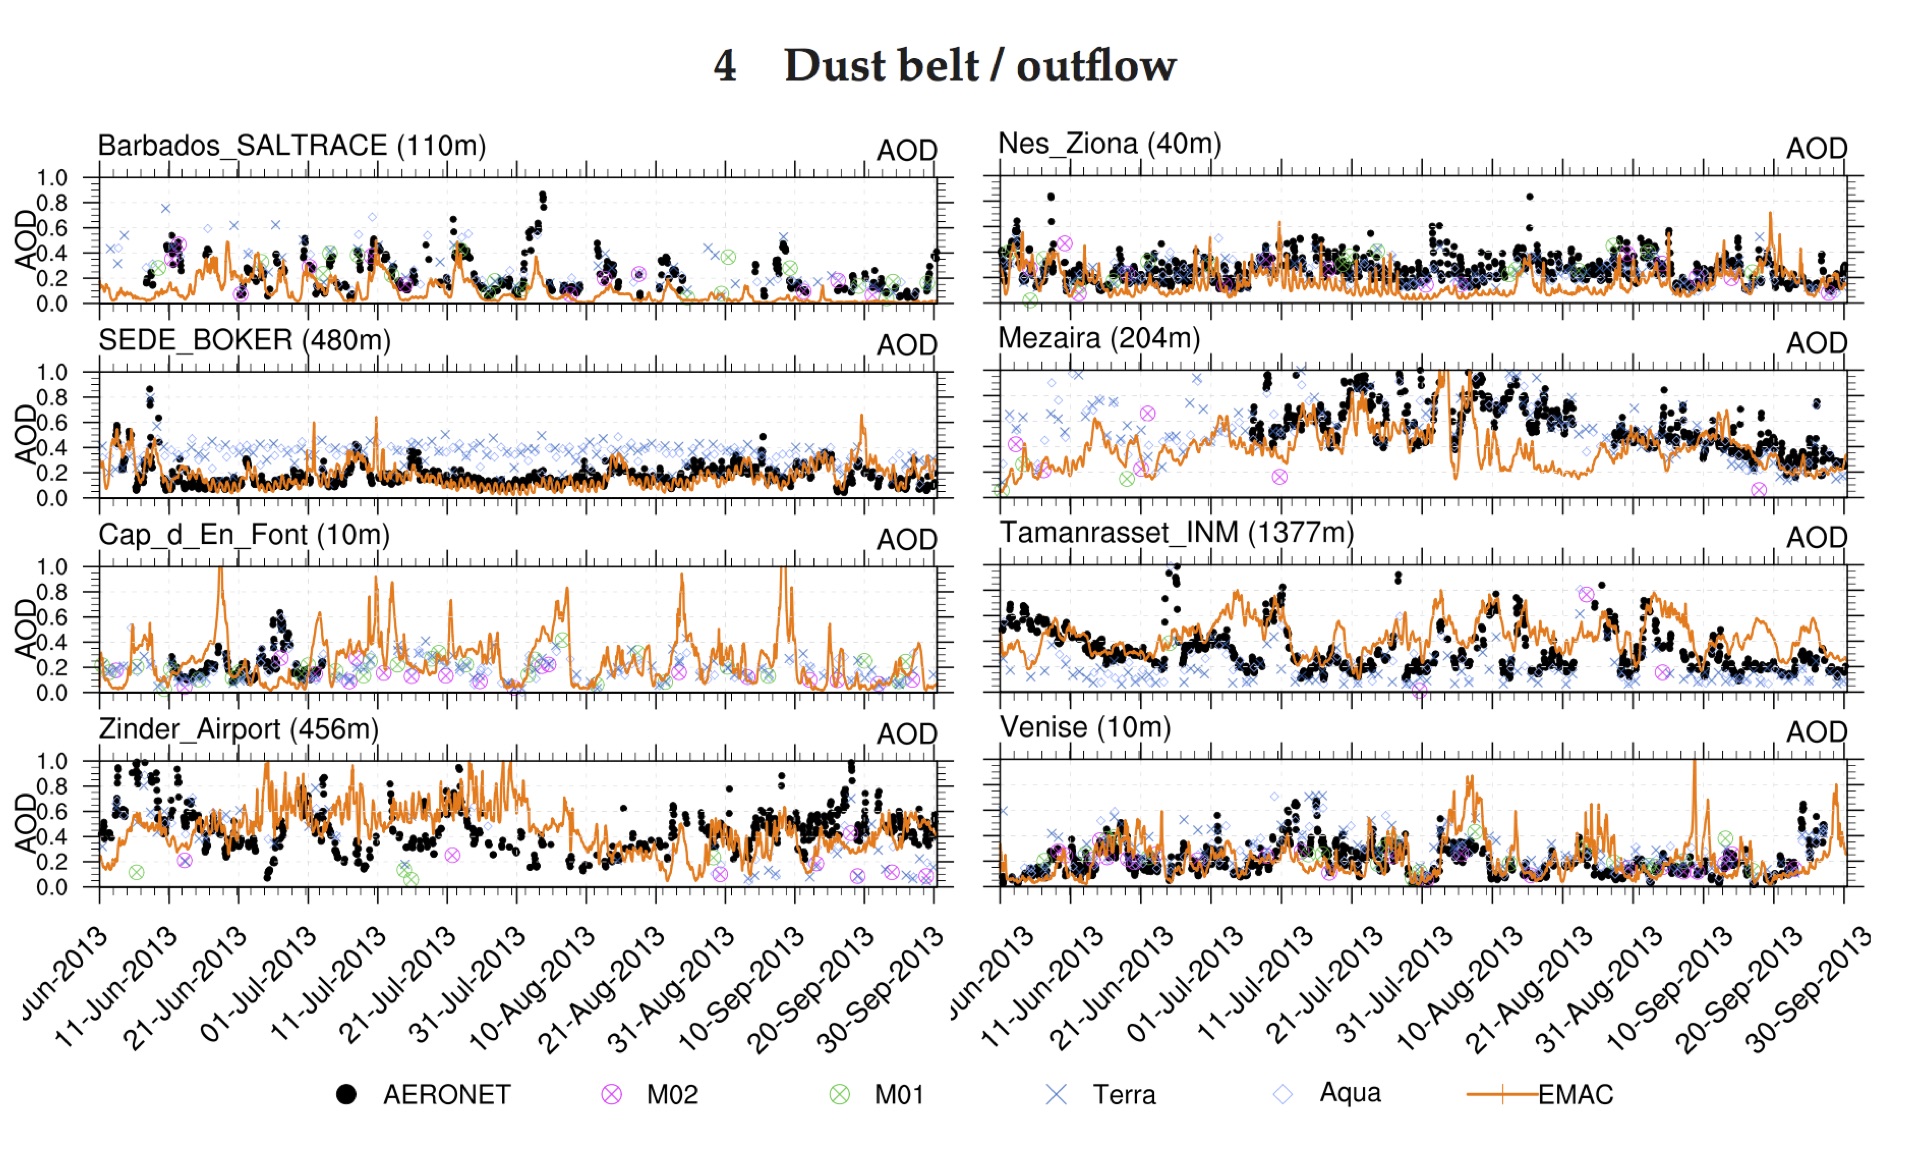
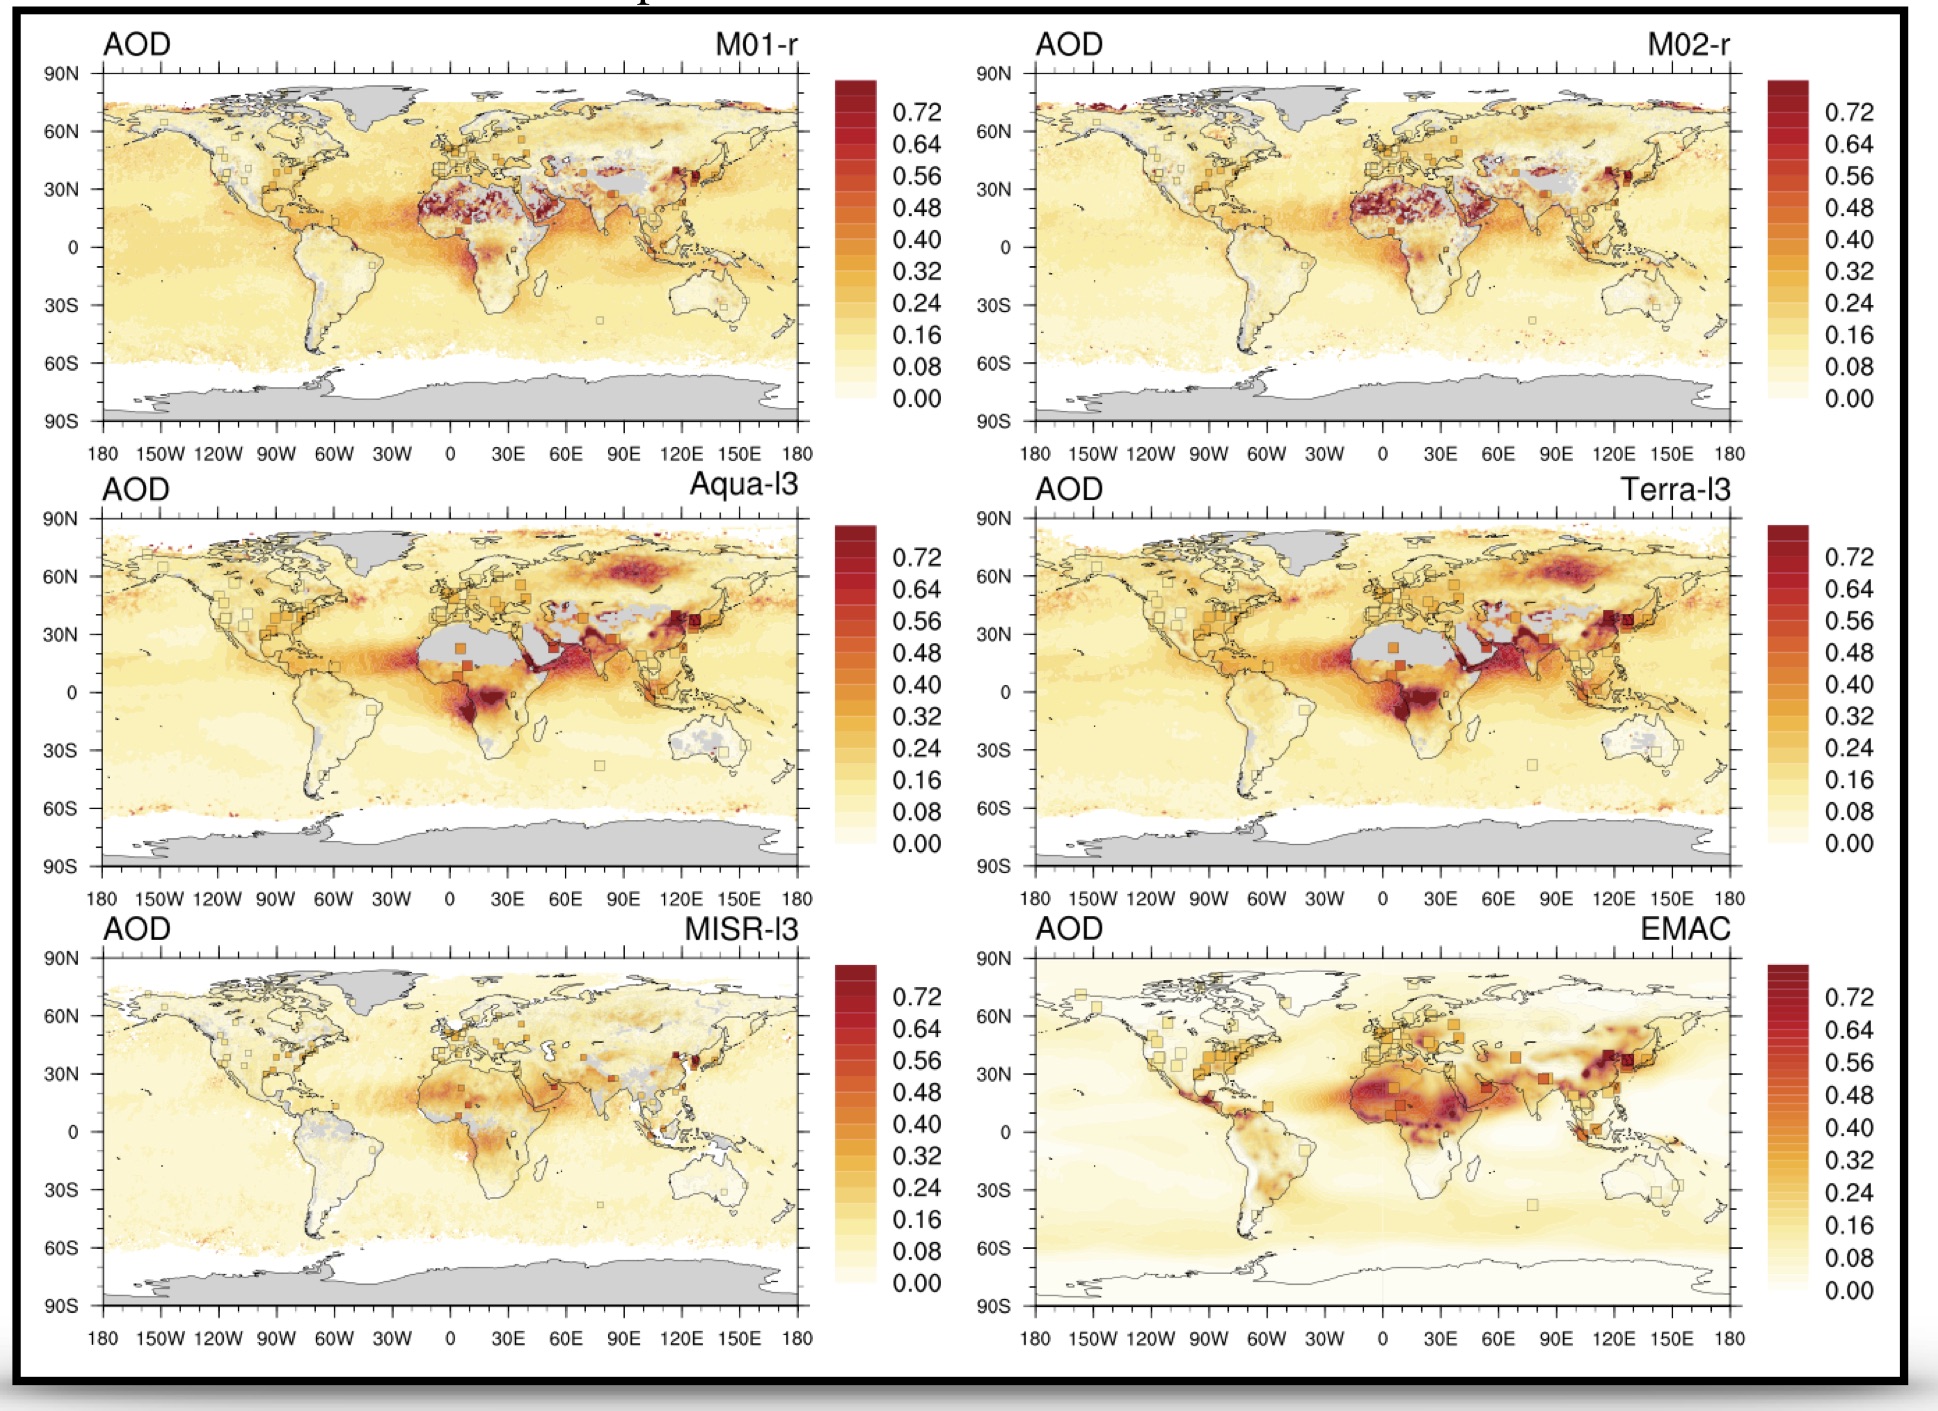
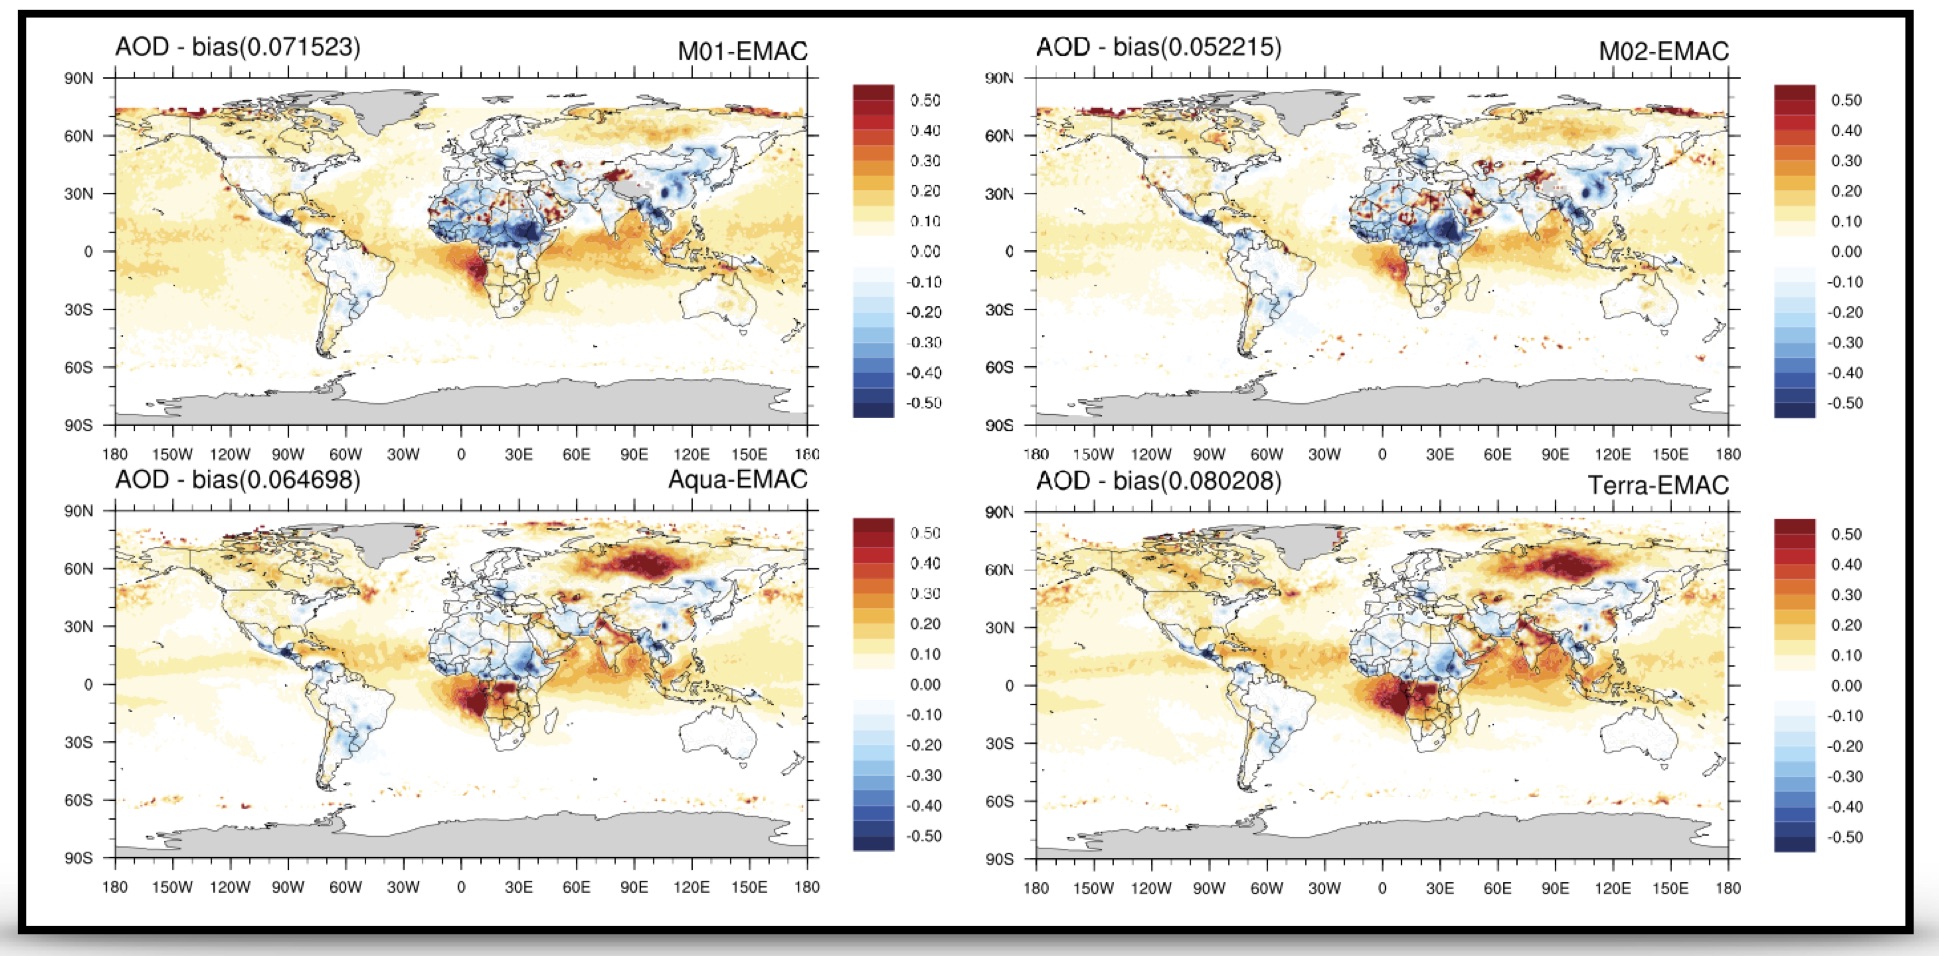
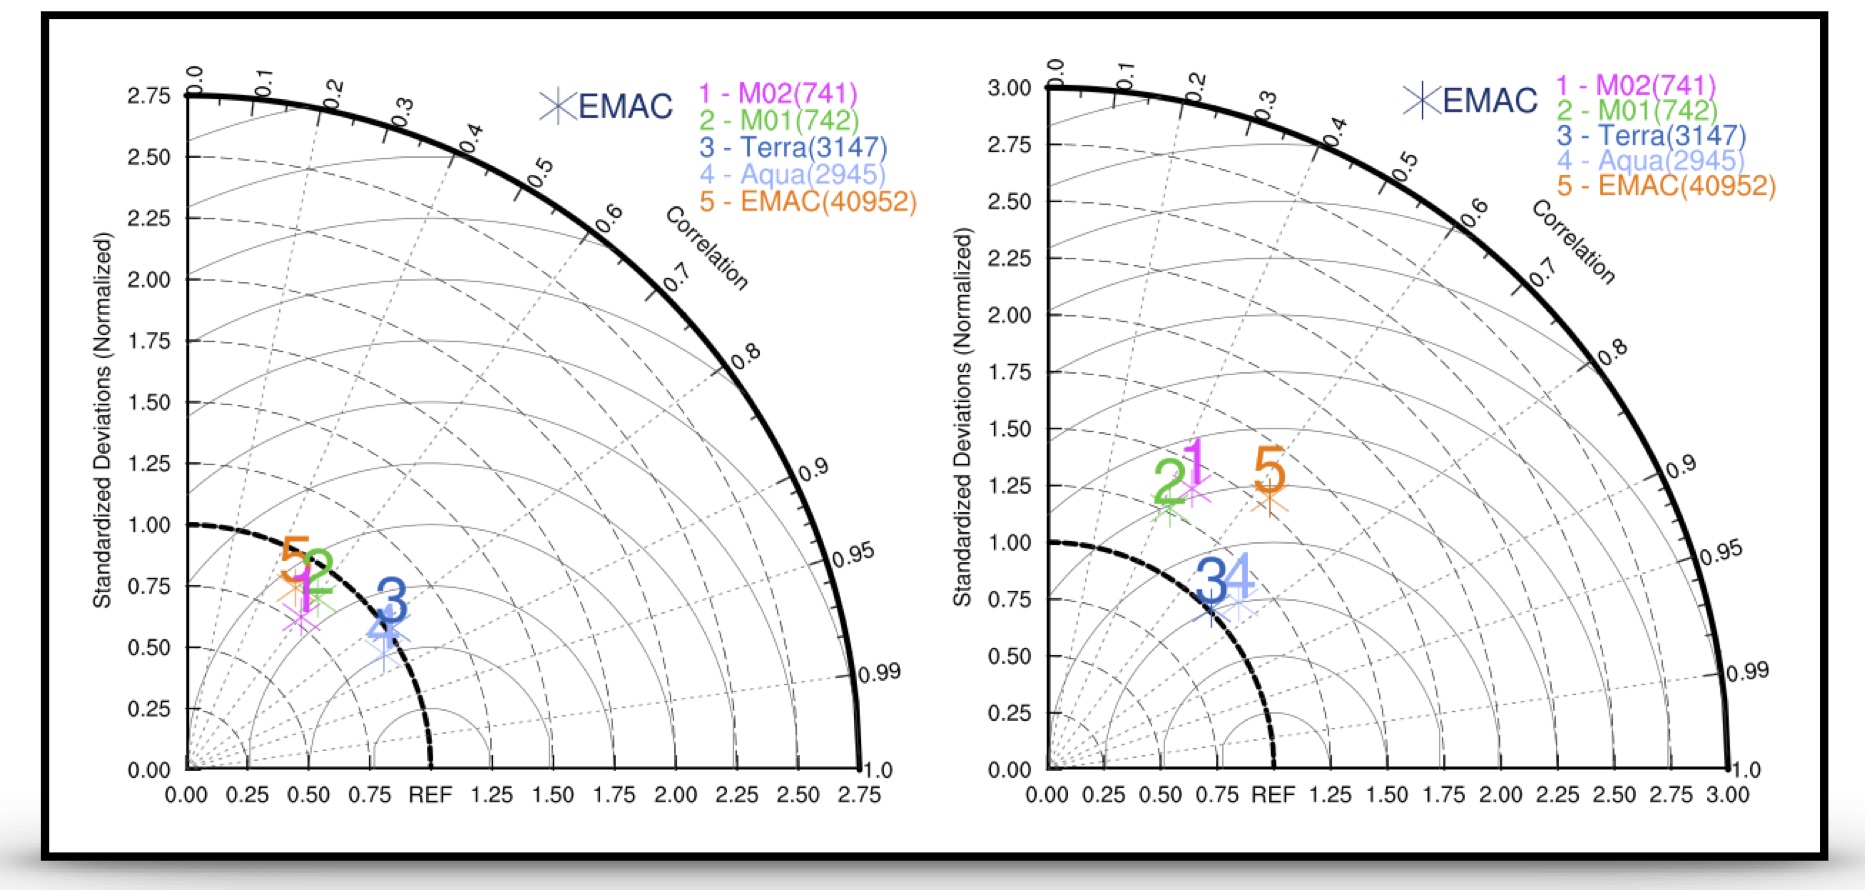
With EUMETSAT ITT 15/210839, we have evaluated the Polar Multi-sensor Aerosol product version 2 (PMAp2) of the Meterological Operational Satellites (MetOp) A and B on global scale using MISR-Terra, MODIS-Aqua/Terra, AERONET, CASTNET, EMEP and EMAC data. Our cross-platform analysis comparison based on a 0.5 hour temporal collocation window and a 30~km radius for the spatial collocation relative to AERONET station observations, and a fairly high spatial (0.1° by 0.1°) and high temporal model resolution (hourly output globally), reveals best the differences and similarities between the various AOD products, which are most likely caused by various cloud masking assumptions. For PMAp2.1, AERONET and EMAC, the best agreement is found for the Caribbean, NE America, European and Asian stations, while generally, the PMAp2 AOD time-series are supported by our model result, which are mostly in good agreement with independent AOD (AERONET, MODIS, MISR), and aerosol composition (CASTNET, EMEP) observations.
Download multipage PDF: Report (66.7 MB).
-
Solar Irradiance Forecasting
Topic: Forecasting results of the Direct Normal Irradiance (DNI) and Global Horizontal Irradiance (GHI) for the Concentrated Solar Power (CSP) Plant Facility of the Cyprus Institute, Pentakomo, Cyprus. First results have been highlighted in the
ECHOES, Vol. 1, Issue 1, 10th February 2017 - The Newsletter of the
Energy oriented Centre of Excellence (EoCoE), phase-I project.
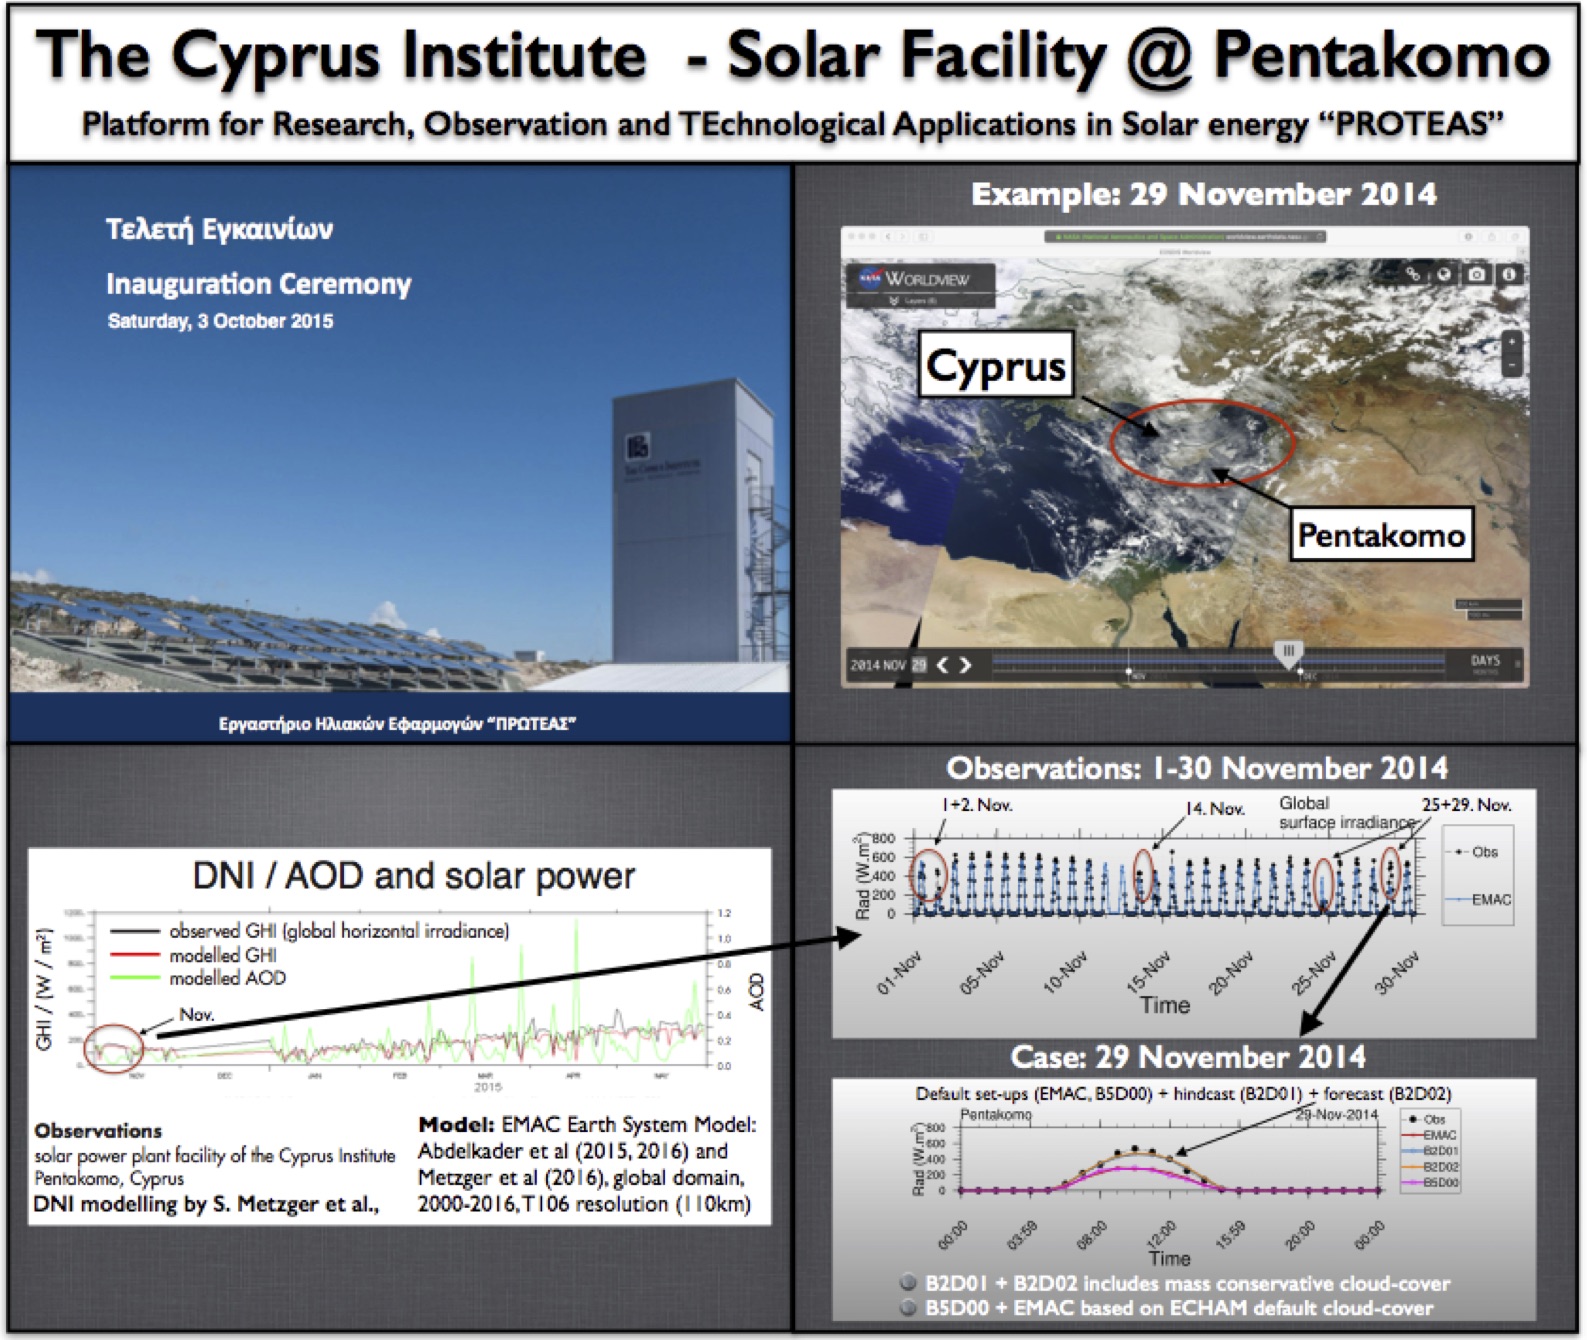
Figure 1 : Map of Cyprus and model forecasts. Daily means of long-term observations (black) of the global horizontal irradiance (GHI) obtained at The Cyprus Institute's Solar Research Facility “PROTEAS”, Pentakomo, and model calculations with the EMAC atmospheric chemistry-climate model (red). Overlaid (green) are the EMAC results for the Aerosol Optical Depth (AOD) − the AOD peaks nicely coincide with the GHI/DNI troughs. The high AOD peaks in spring 2015 are caused by strong outflow events of mineral dust, which is captured rather well by this high-resolution version of EMAC, which has been nudged to ERA-Interim reanalysis data of the European Centre for Medium-Range Weather Forecasts (ECMWF). Our EMAC aerosol version is developed and maintained at the Cyprus Institute (CyI), in close collaboration with the Max Planck Institute for Chemistry (MPIC).
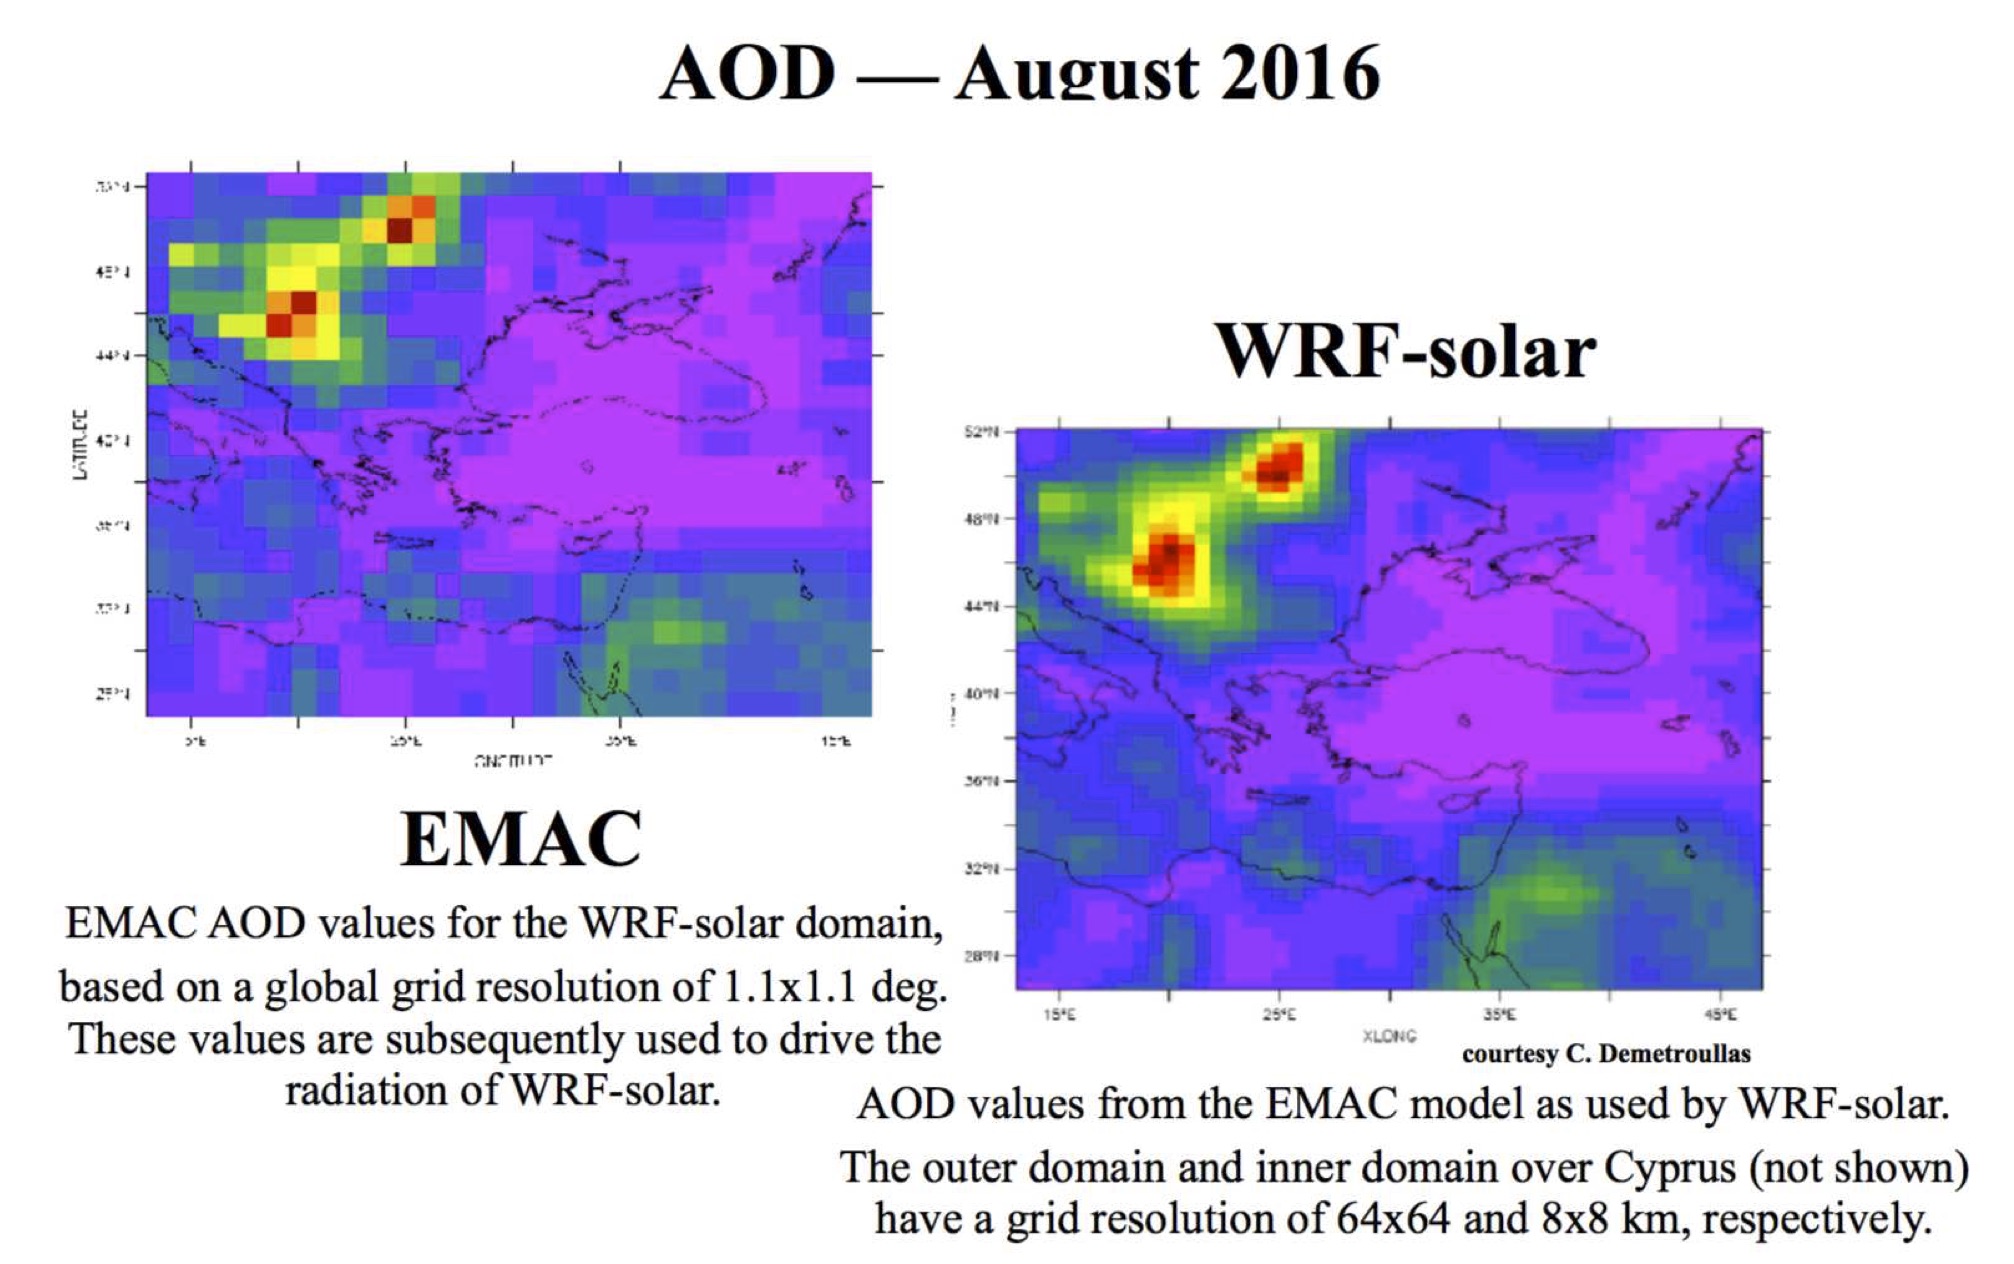
Figure 2 : Coupling of EMAC and WRF-solar through AOD.
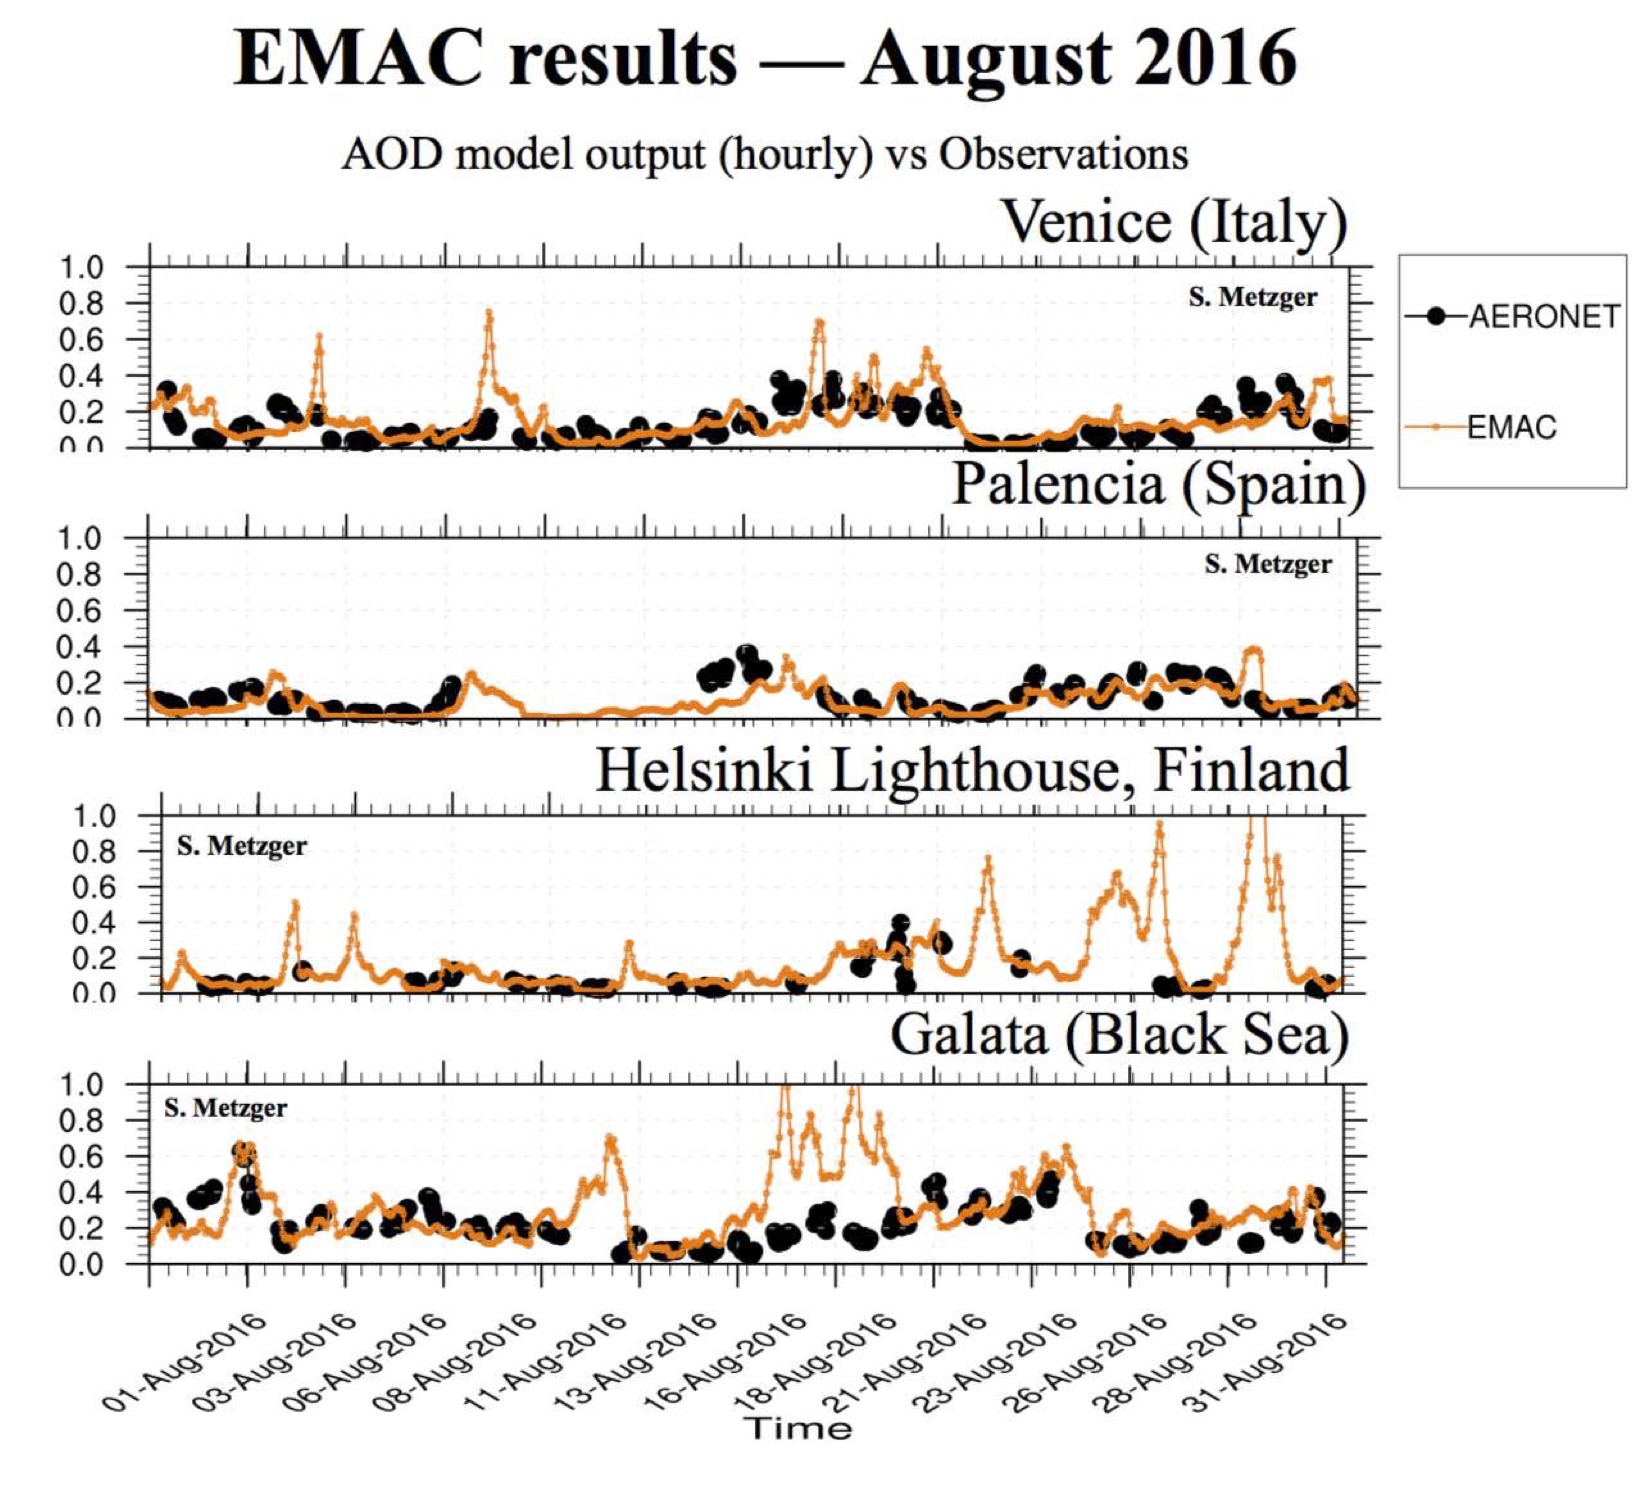
Figure 3 : EMAC simulation versus AOD ground station observations.
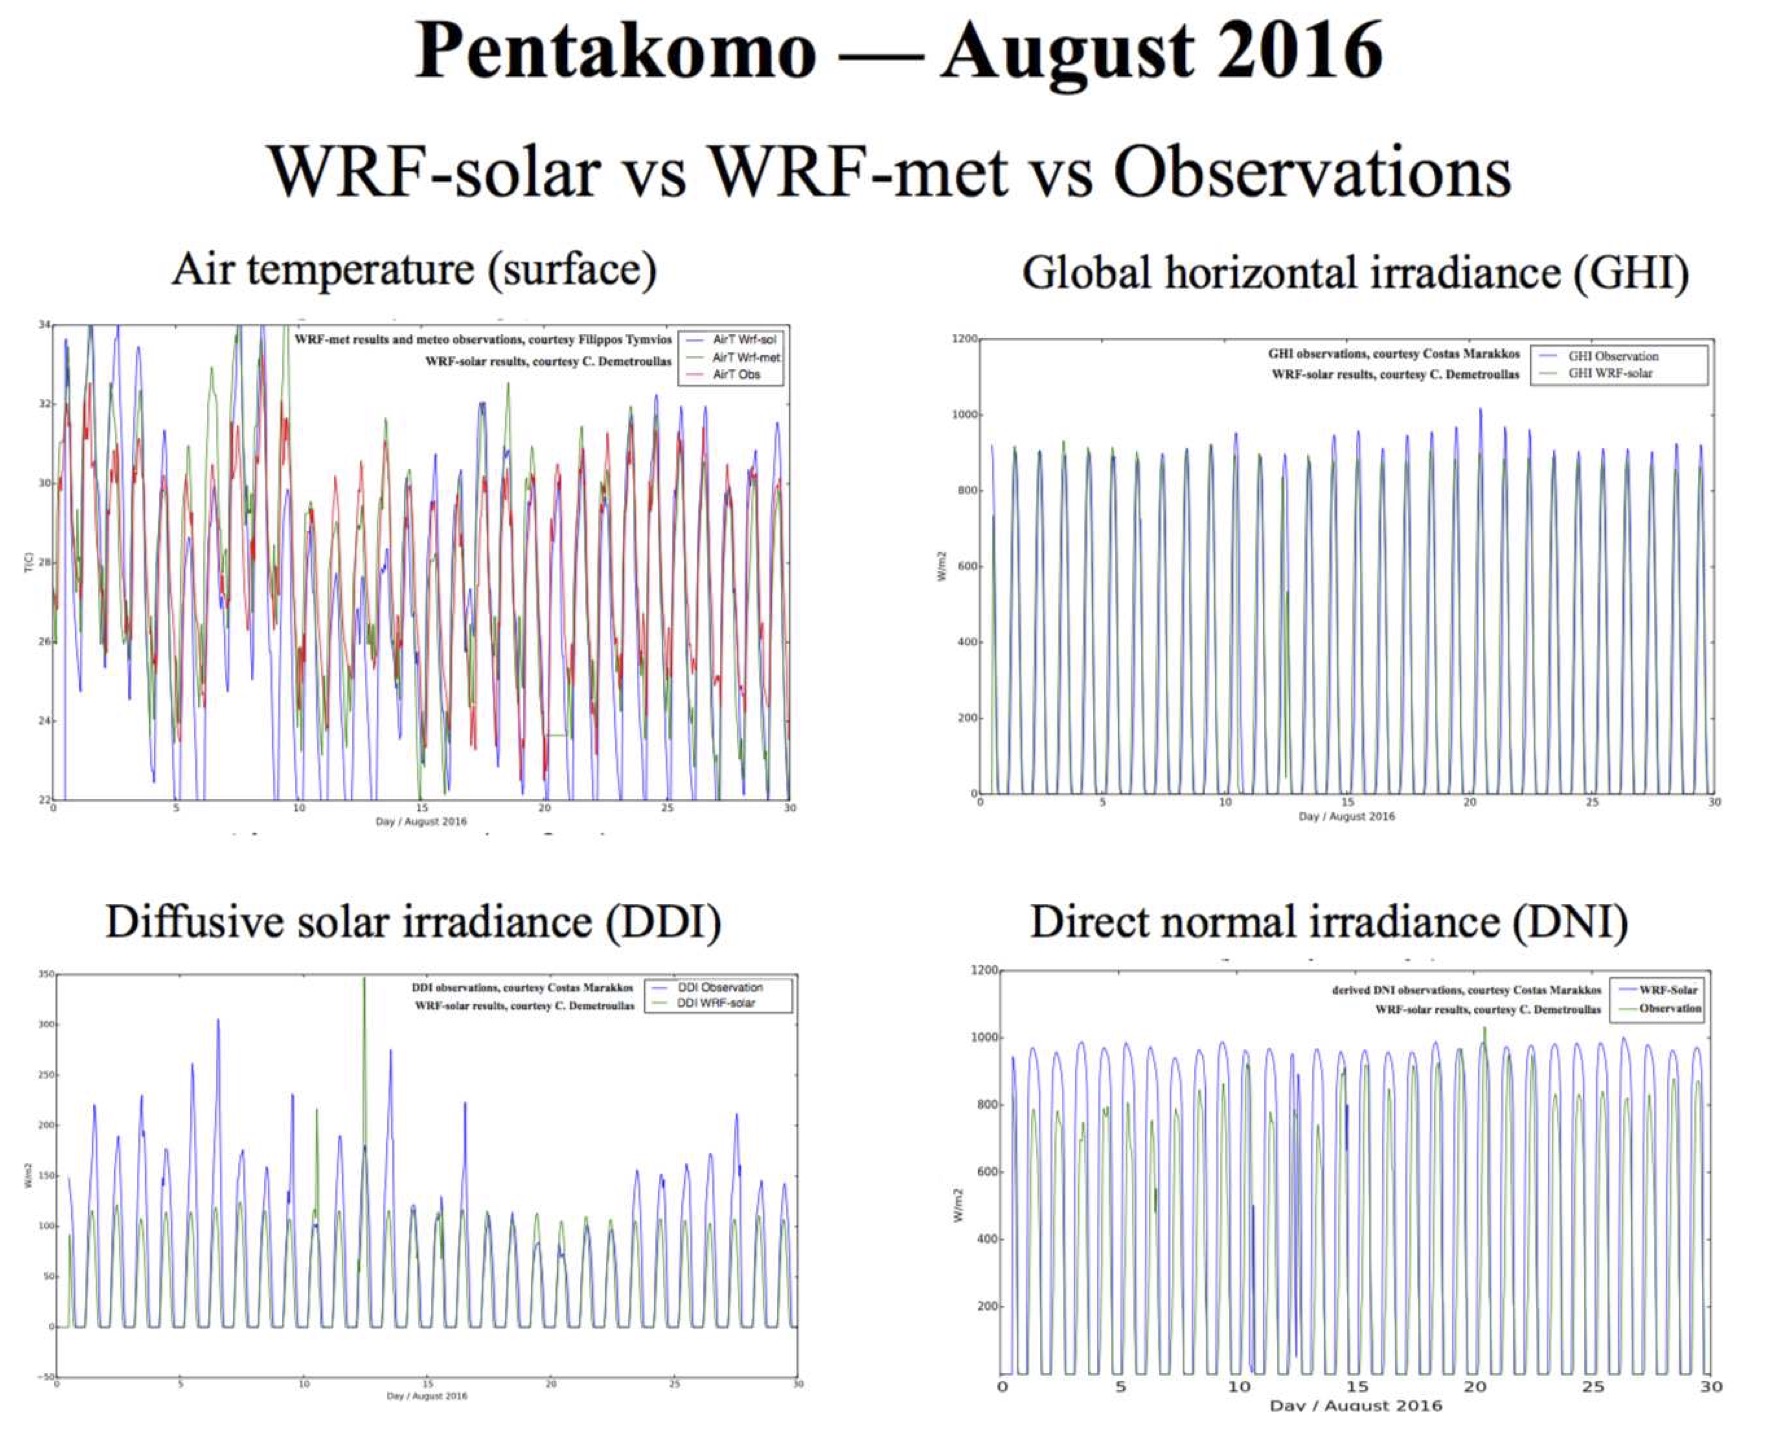
Figure 4 : WRF-solar reference simulations versus WRF-met and observations.
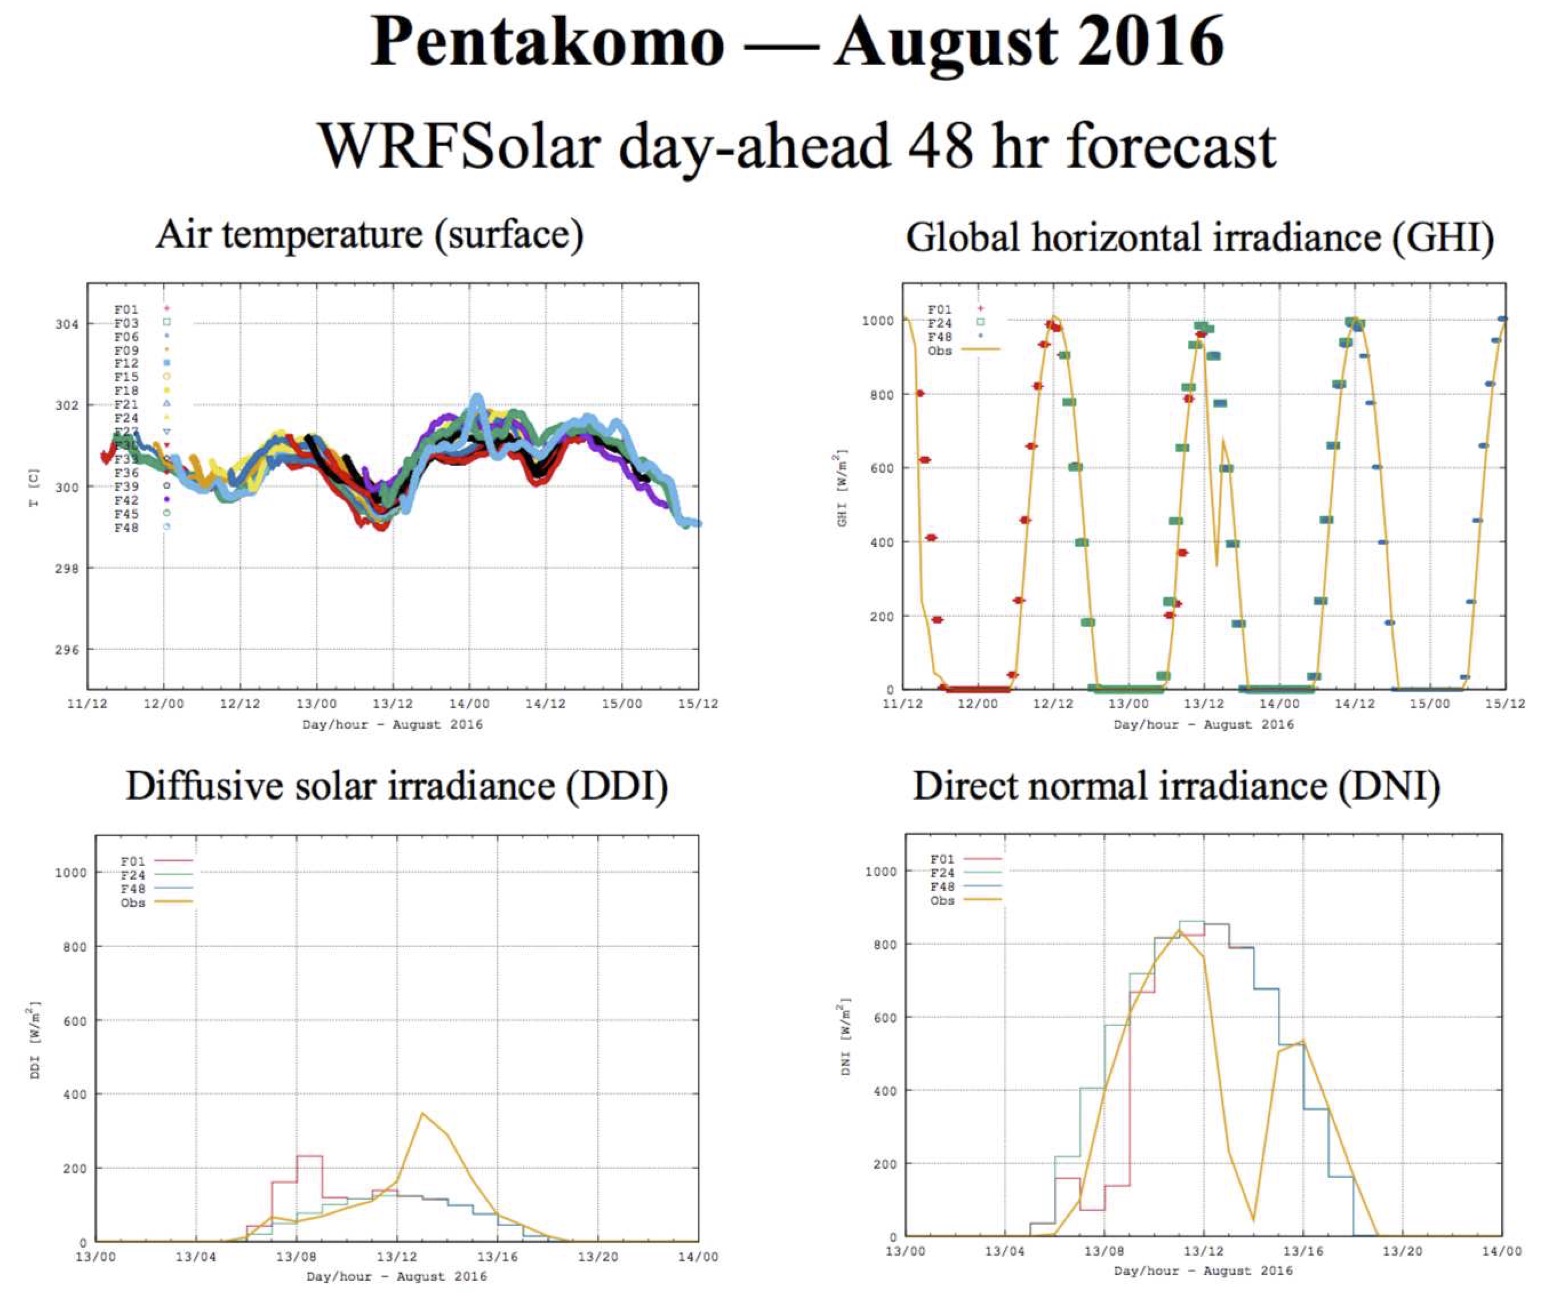
Figure 5 : WRF-solar day-ahead forecasts driven by EMAC AOD.
Short Summary Within the European Commission HORIZON 2020 EoCoE project, task WP2.3, Optimal Operation of Concentrated Solar Power (CSP) under Weather Uncertainty, The Cyprus Institute, has generated day-ahead forecasts of the direct normal irradiance (DNI) for the Pentakomo CSP field facility that are based on a sophisticated coupling of WRF-solar with a “solar” version of EMAC. The augmented EMAC model results — a high resolution Earth System Model with fully coupled aerosol-chemistry-cloud-radiation feedbacks [1-3], which has been developed by S. Metzger, and colleagues at CyI and MPIC — shows improved model results of the Aerosol Optical depth (AOD) [4] and the Global Horizontal Irradiation (GHI), as shown in Figure 1-3. These improvements help to improve the DNI forecasting, since GHI and DNI are strongly related to the AOD. Both radiative properties are largely influenced by the aerosol hygroscopic growth and the associated aerosol water (AW) mass, which often controls the atmospheric visibility, haze and the formation of clouds, especially optically thin clouds. To allow an efficient application of a research model, we have aimed to reduce the complexity of the required aerosol chemistry and AW thermodynamics of our EMAC version to a minimum [5-7], so that numerical forecasts can be obtained. Subsequently, we have coupled the AOD values of EMAC [4], based on a sophisticated calculation of aerosol-chemistry, dust emissions and chemical aging of mineral particles [1-3], with the cloud and radiation of WRF-solar (Figure 2) to improve DNI forecasting with WRF-solar. Our coupled EMAC-WRF-solar results have been compared against point observations at Pentakomo, and reference simulations of WRF-met from the Cyprus met-office (Figure 4). Additionally, we have generated 48 day-ahead forecasts (each a 48 hours prediction with a one-hour moving initialization), shown in Figure 5. The coupled WRF-solar results show a considerable sensitivity to the AOD values provided by EMAC, and can help to improve the DNI forecasting for certain conditions, i.e., when aerosol loadings become dominant. Further improvements of the EMAC-WRF-solar coupling might be required for DNI forecasting, which are, however, beyond the scope of this WP2.3 contribution.
[1.] Abdelkader, M., Metzger, S., Mamouri, R. E., Astitha, M., Barrie, L., Levin, Z., and Lelieveld, J.: Dust–air pollution dynamics over the eastern Mediterranean, Atmos. Chem. Phys., 15, 9173–9189, doi:10.5194/acp-15-9173-2015, http://www.atmos-chem-phys.net/15/9173/2015/acp-15-9173-2015.html, 2015.
[2.] Abdelkader, M., Metzger, S., Steil, B., Klingmüller, K., Tost, H., Pozzer, A., Stenchikov, G., Barrie, L., and Lelieveld, J.: Sensitivity of transatlantic dust transport to chemical aging and related atmospheric processes, Atmos. Chem. Phys., 17, 3799-3821, doi:10.5194/acp-17-3799-2017, https://www.atmos-chem-phys.net/17/3799/2017/, 2017.
[3.] Klaus Klingmüller, Swen Metzger, Mohamed Abdelkader, Vlassis A. Karydis, Georgiy L. Stenchikov, Andrea Pozzer, and Jos Lelieveld, Revised mineral dust emissions in the atmospheric chemistry–climate model EMAC (MESSy 2.52 DU_Astitha1 KKDU2017 patch): Geosci. Model Dev., 11, 989-1008, https://doi.org/10.5194/gmd-11-989-2018, 2018.
[4.] Metzger, S., Abdelkader, M., Klingmueller, K., Steil, B., and Lelieveld, J.: Comparison of Metop PMAp Version 2 AOD Products using Model Data, Final Report EUMETSAT ITT 15/210839, EUMETSAT, Max Planck Institute for Chemistry, Department of Atmospheric Chemistry, http://bit.ly/2Epxf9b, 2016.
[5.] Metzger, S., B. Steil, L. Xu, J. E. Penner, and J. Lelieveld, New representation of water activity based on a single solute specific constant to parameterize the hygroscopic growth of aerosols in atmospheric models, Atmos. Chem. Phys., 12, 5429–5446, doi:10.5194/acp-12-5429-2012, http://www.atmos-chem-phys.net/12/5429/2012/acp-12-5429-2012.html, 2012.
[6.] Metzger, S., B. Steil, M. Abdelkader, K. Klingmüller, L. Xu, J.E. Penner, C. Fountoukis, A. Nenes, and J. Lelieveld; Aerosol Water Parameterization: A single parameter framework; Atmos. Chem. Phys., 16, 7213–7237, doi:10.5194/acp-16-7213-2016, www.atmos-chem-phys.net/16/7213/2016/, 2016.
[7.] Metzger, S., Abdelkader, M., Steil, B., and Klingmüller, K.: Aerosol water parameterization: long-term evaluation and importance for climate studies, Atmos. Chem. Phys., https://doi.org/10.5194/acp-18-16747-2018, https://www.atmos-chem-phys.net/18/16747/2018/acp-18-16747-2018.html, 2018.
Download multipage PDF: Document (771 KB).
-
 EoCoE Project deliverable:

Formulation for optimization under uncertainty,
Cumpston, J.; Metzger, S.; Mitsos, A - September 30, 2018.
Download multipage PDF: Deliverable (4.9 MB).
-
Climate Change Modeling
Model results that represent our key developments are published in:
Short Summary
This paper discusses the importance of aerosol water for aerosol optical depth (AOD) calculations using a long-term evaluation of the global chemistry climate and Earth system model EMAC through a comparison of EQSAM4clim and ISORROPIA II with observations at climate timescales. Sensitivity studies with different levels of chemical aging and associated water uptake demonstrate the importance of aerosol water for climate studies.
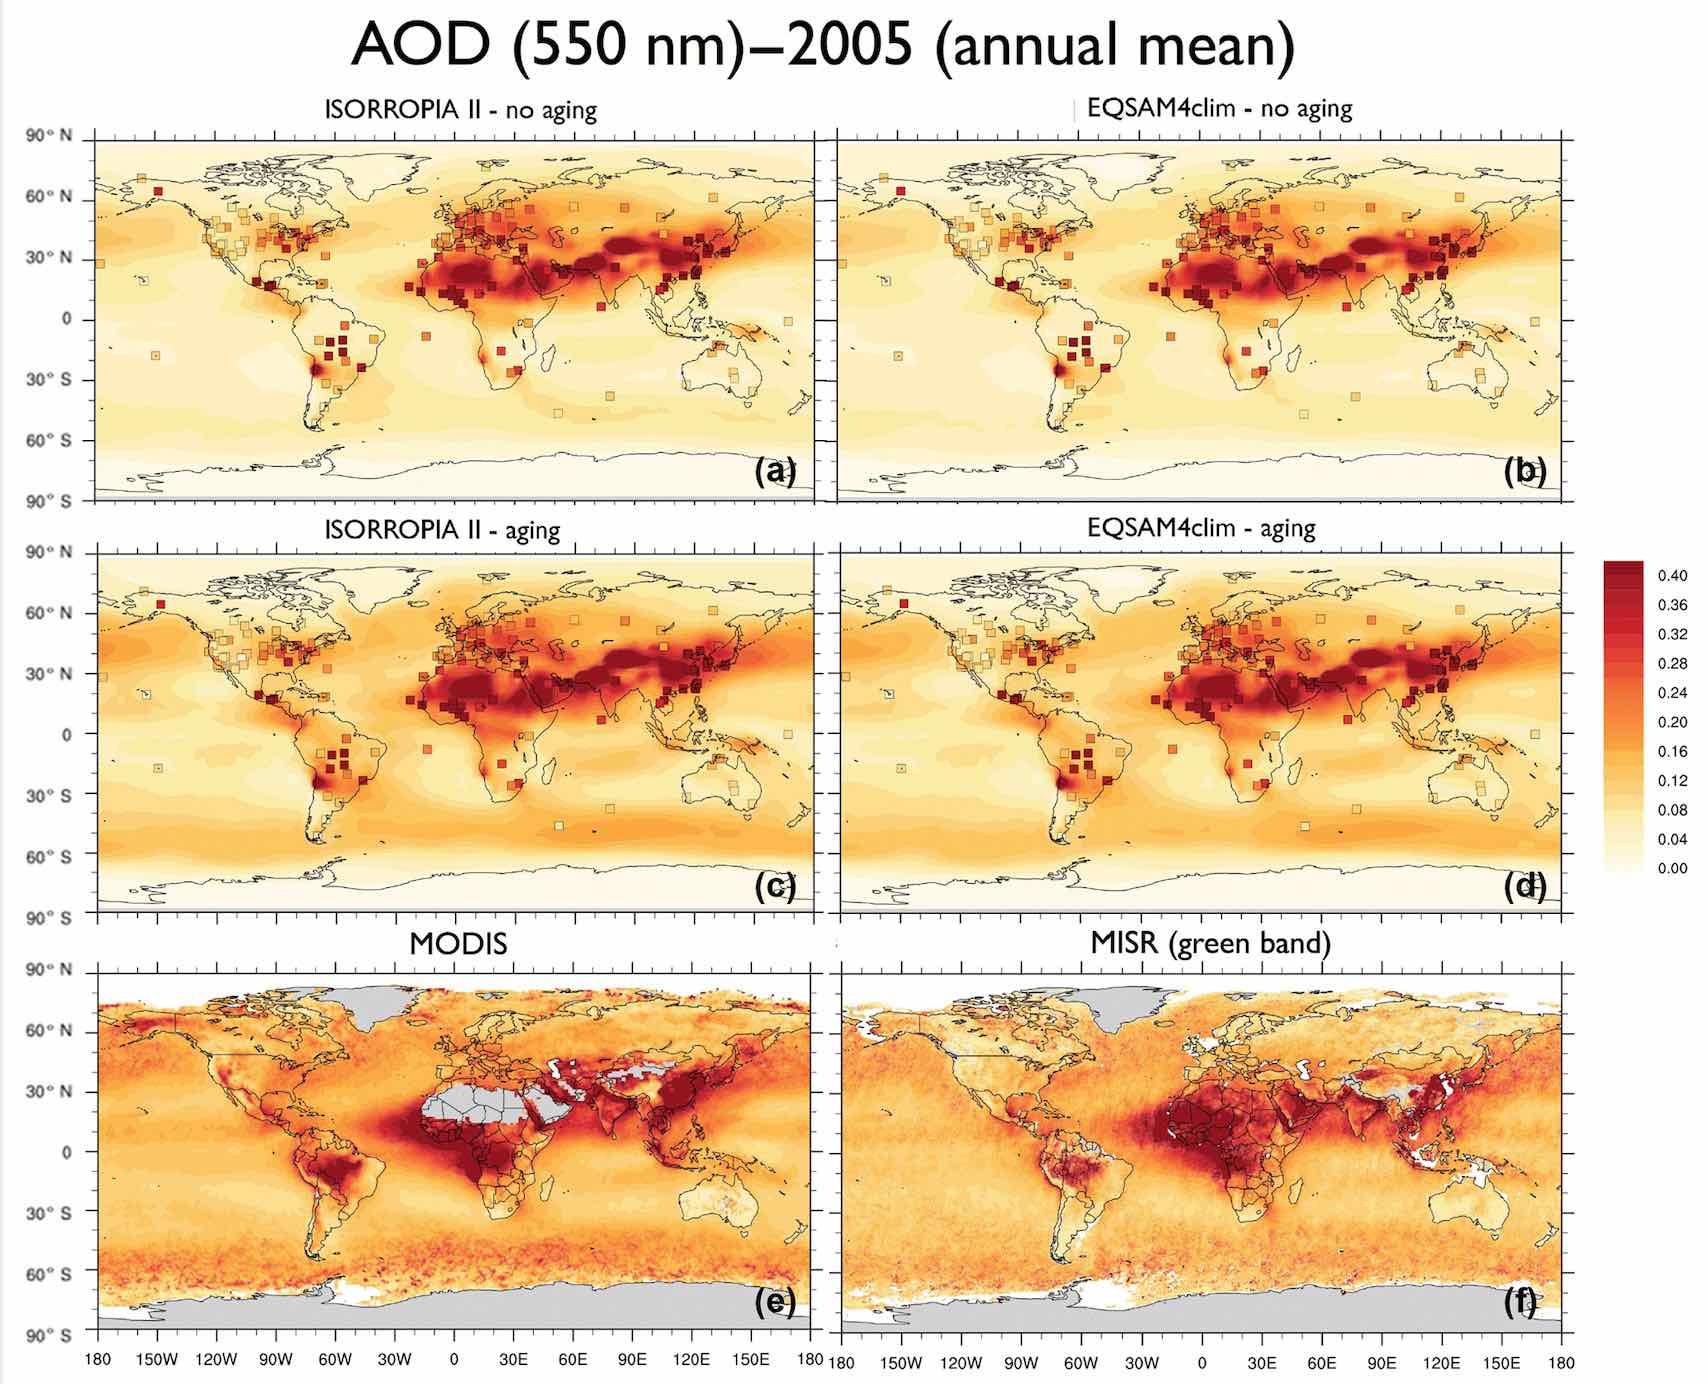
Fig. 12. EMAC model AOD results for the year 2005 (annual mean) based on ISORROPIA II (a, c) and EQSAM4clim (b, d). (a, b) No aging and (c, d) aging cases. AERONET ground station observations are included as squares (same color scale). (e, f) Satellite observations by MODIS (e) and MISR (f) (550 nm, annual mean 2005). MODIS monitors the ambient AOD from space and provides data over the oceans and, except deserts, also over continents (http://modis-atmos.gsfc.nasa.gov). The MISR aerosol product is available globally (products can be obtained from http://disc.sci.gsfc.nasa.gov/giovanni.
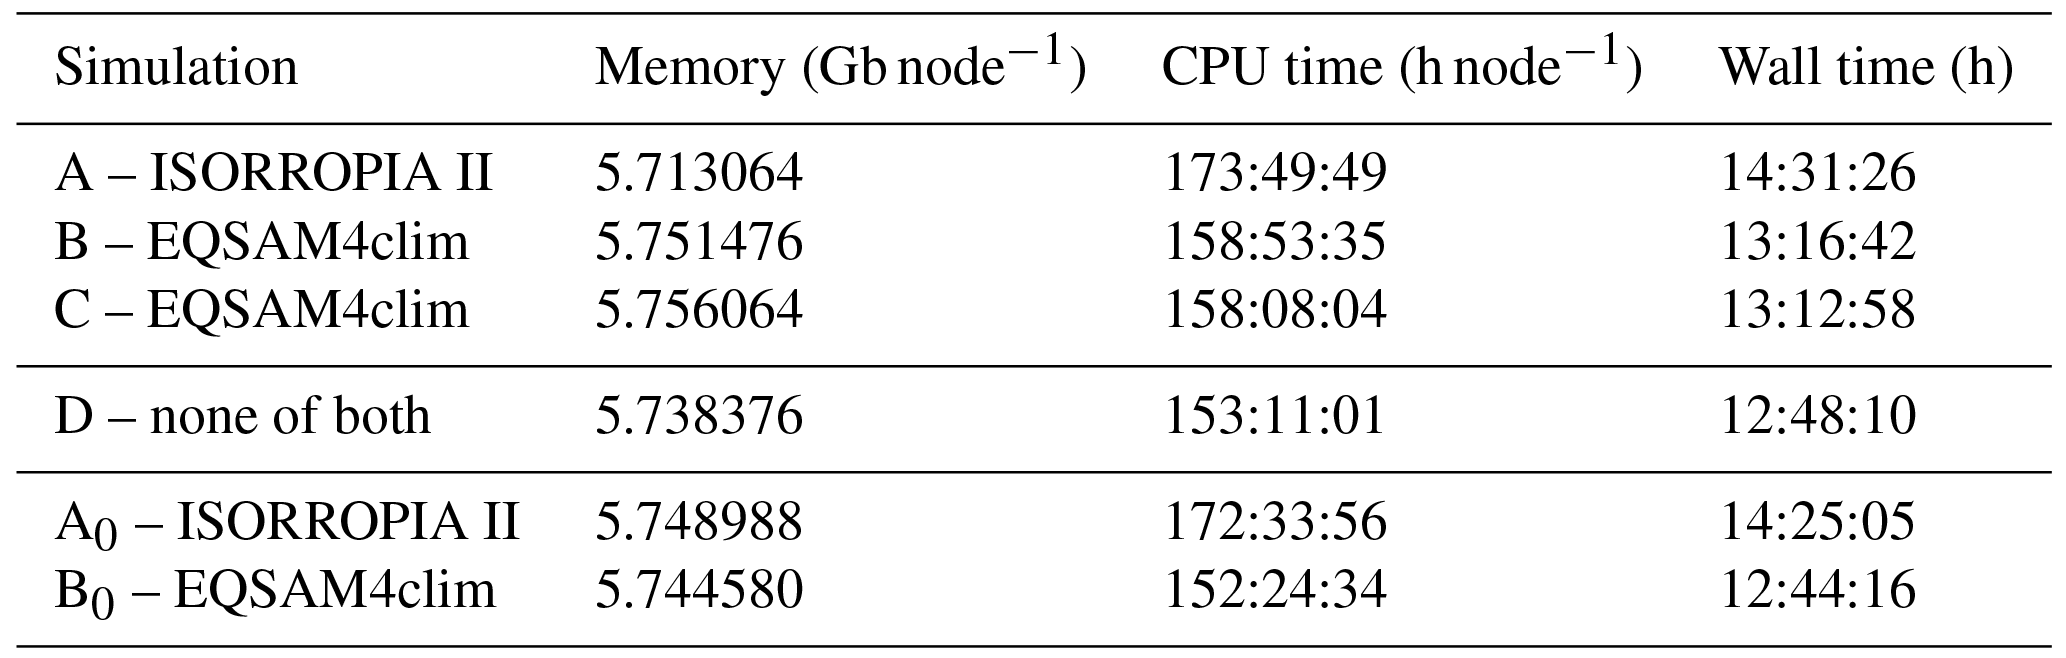
Table 5. CPU times. EMAC @ 96 CPU cores, Cy-Tera (http://web.cytera.cyi.ac.cy).
Short Summary Computational efficiency is a key constraint on our model development. To scrutinize the model performance, we compare both gas–aerosol partitioning schemes (EQSAM4clim and ISORROPIA II) using the simulation period of 2005. Table 5 presents the computational burden (CPU times) for different EMAC simulations (T42L31). Experiments A, B, C, and D correspond to a no aging EMAC setup (results of Exp. A and B are shown in Sect. S1.3). The four simulations only differ by the constraint on the gas–aerosol partitioning scheme; i.e., Exp. A represents ISORROPIA II, Exp. B and C represent two simulations of EQSAM4clim (identical setup, just quantifying numerical noise of the computing architecture), while for Exp. D the call to the gas–liquid–solid partitioning scheme has been commented out, while all other GMXe processes remained unchanged (Sect. 2.2). Exp. D therefore represents the minimum of CPU time that is required for our GMXe aerosol setup on the Cy-Tera supercomputer. Two additional experiments, labeled Exp. A0 and Exp. B0, represent sensitivity simulations of ISORROPIA II and EQSAM4clim, respectively. Both only omit anthropogenic emissions in our EMAC setup, while all other EMAC processes remained the same as for Exp. A and B.
Table 5 reveals the real CPU utilization. The comparison of the numbers shows (i) a dependency of both partitioning schemes on the aerosol setup and composition (Exp. A versus A0 and Exp. B versus B0), (ii) that the dependency of the additional computational costs for EQSAM4clim in addition to GMXe is small (Exp. B and C versus Exp. D and B0 versus D), while (iii) this is not so much the case for ISORROPIA II (Exp. A versus D and A0 versus D). Given the uncertainty in these numbers due to the different system loads (indicated by Exp. B versus C), the additional computational cost of EQSAM4clim is clearly negligible for climate applications on architecture such as of the Cy-Tera cluster (Intel Westmere X5650 processors, two hexa-core sockets per node). But the differences depend on the system and its usage and are generally smaller on pure scalar architectures. On typical vector machines, however, these differences can significantly increase since the optimization of a short code can be much more effective. For instance, for the previous supercomputer system at the German Climate Research Center (DKRZ), the gain in CPU time has been about an order of magnitude. The fraction of the total EMAC CPU burden for a 2-month simulation was about 20 % for ISORROPIA II, while EQSAM4clim contributed less than 2 % (both on 128 CPUs@“Blizzard”, i.e., IBM Power6 and measured with Scalasca.
EQSAM4clim has the advantage of being a short Fortran 90 code with approximately 850 lines, including comments (or about eight pages; see Appendix of Metzger et al., 2016a). For comparison, ISORROPIA II roughly counts 36 300 lines (or approx. 360 pages). This is about one-third of the entire source code of the EMAC underlying climate code (ECHAM5.3.02), which has about 119 900 lines of Fortran 90 code (also including comments). It should be emphasized that ISORROPIA II was developed for air quality rather than climate modeling, and we offer EQSAM4clim as an alternative for computationally demanding climate simulations.
EQSAM4clim is freely available for research and noncommercial applications. For commercial applications special licensing applies. For both cases, please contact the author (Swen Metzger @ ResearchConcepts.io).Download - PDF: Publication (10.6 MB) and/or Supplement (10.2 MB).

-
EMAC long-term evaluation results
Short Summary
Our EMAC model has been thoroughly evaluated with Metzger et al. (2016a,b and 2018) and Abdelkader et al. (2015, 2017). Below we show selected time-series. For details we refer to our EUMETSAT ITT 15/210839 report (Metzger et al., 2016b). Figure 1-2 show that EMAC AOD and total particulate matter (PM) results based on EQSAM4clim and ISORROPIA II are close to long-term observations for the period 2000-2013 at stations with different aerosol types and climatic regions. Figures 3 shows the corresponding lumped aerosol concentrations (liquids+solids) of major anions and ammonium, while Figure 4 shows the major mineral cations used in our studies. Note that the cation-anion neutralization products yield various salt compounds that make up the PM, and, together with the associated water uptake of these salt compounds, they determine our AOD. Figure 5 shows the longterm (2000-2013) seasonal aerosol concentrations and composition (sulfate, ammonium, nitrate, sodium, chloride, calcium, potassium and magnesium) of EMAC compared to The European Monitoring and Evaluation Programme (EMEP) and compared to the Clean Air Status and Trends Network (CASTNET) of the United States of America (USA), while Figure 6 shows the spacial EMAC aerosol water mass AOD fraction that corresponds to the AOD distribution shown in Figure 7.
The EMAC simulations are based on two gas-liquid-solid partitioning schemes: ISORROPIA II (Exp A), EQSAM4clim (Exp B).
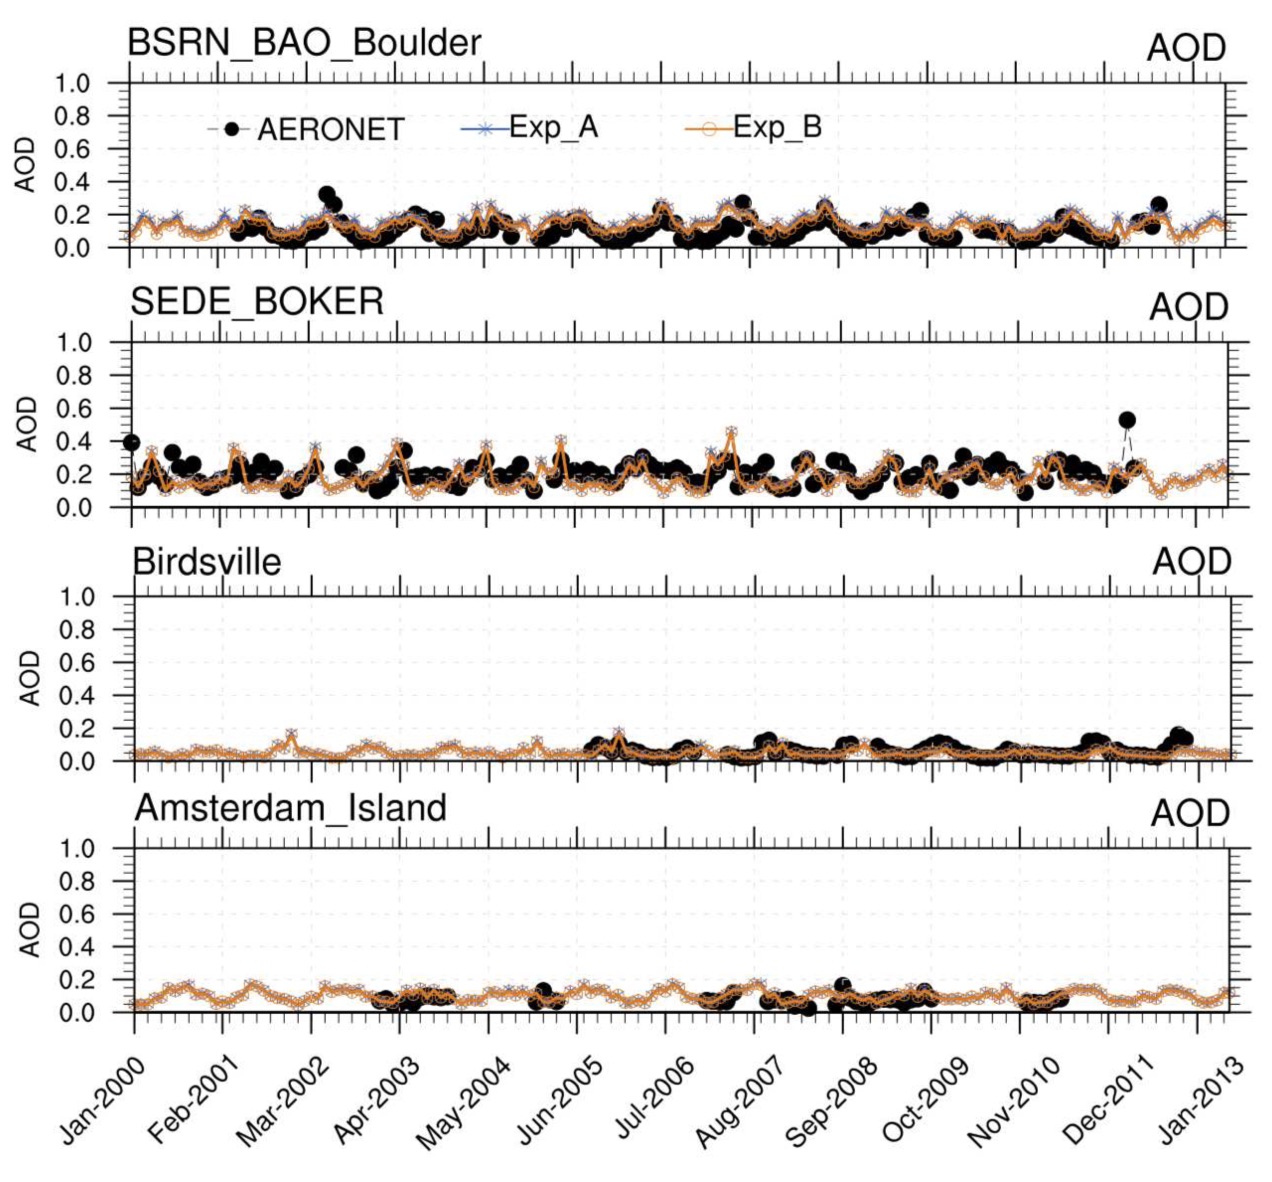
Figure 1 : AOD (monthly mean) at four AERONET stations that have long-term data available and which represent different aerosol types and climatic regions (simulation period 2000-2013). AERONET observations (black line), EMAC - Exp A (ISORROPIA II, blue line), Exp B (EQSAM4clim, orange line); AERONET.
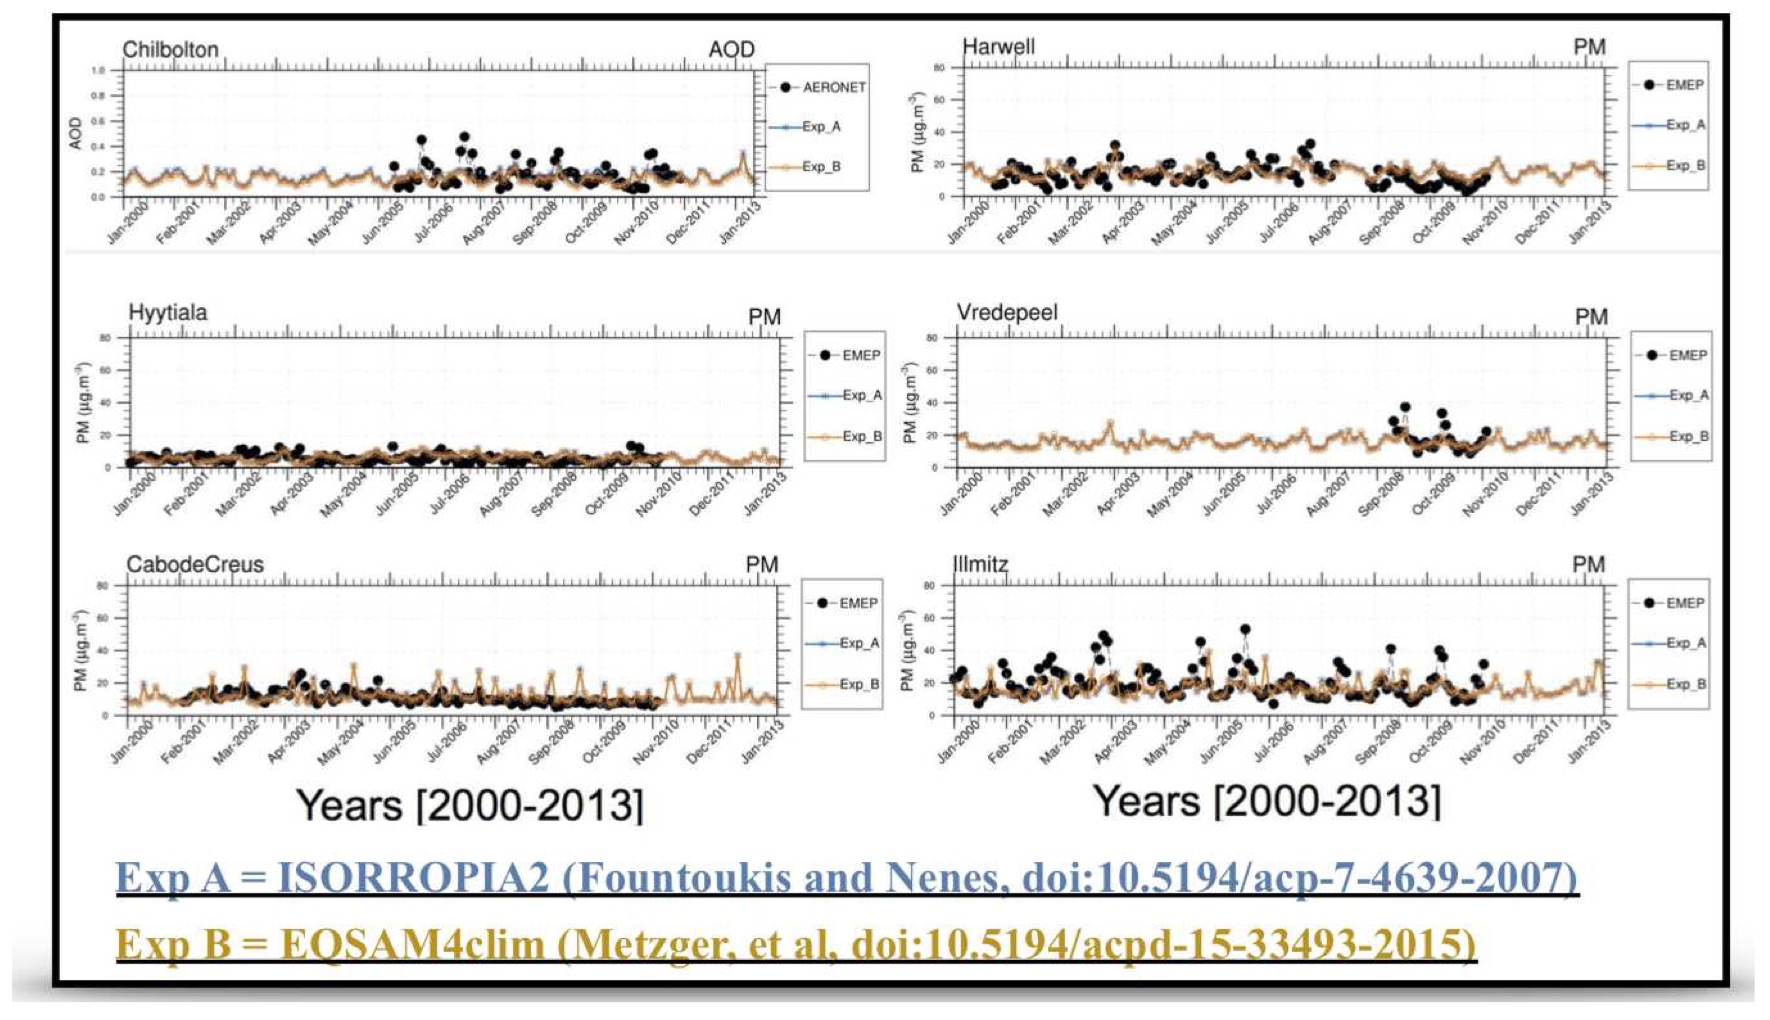
Figure 2 : EMAC AOD simulations, ISORROPIA II (blue line), EQSAM4clim (orange line), total particulate matter (PM) (lumped liquid+solid aerosol compounds) at selected at AERONET and EMEP stations that have long-term data available; complementing the results shown above: Top row: both stations lie within one model grid.
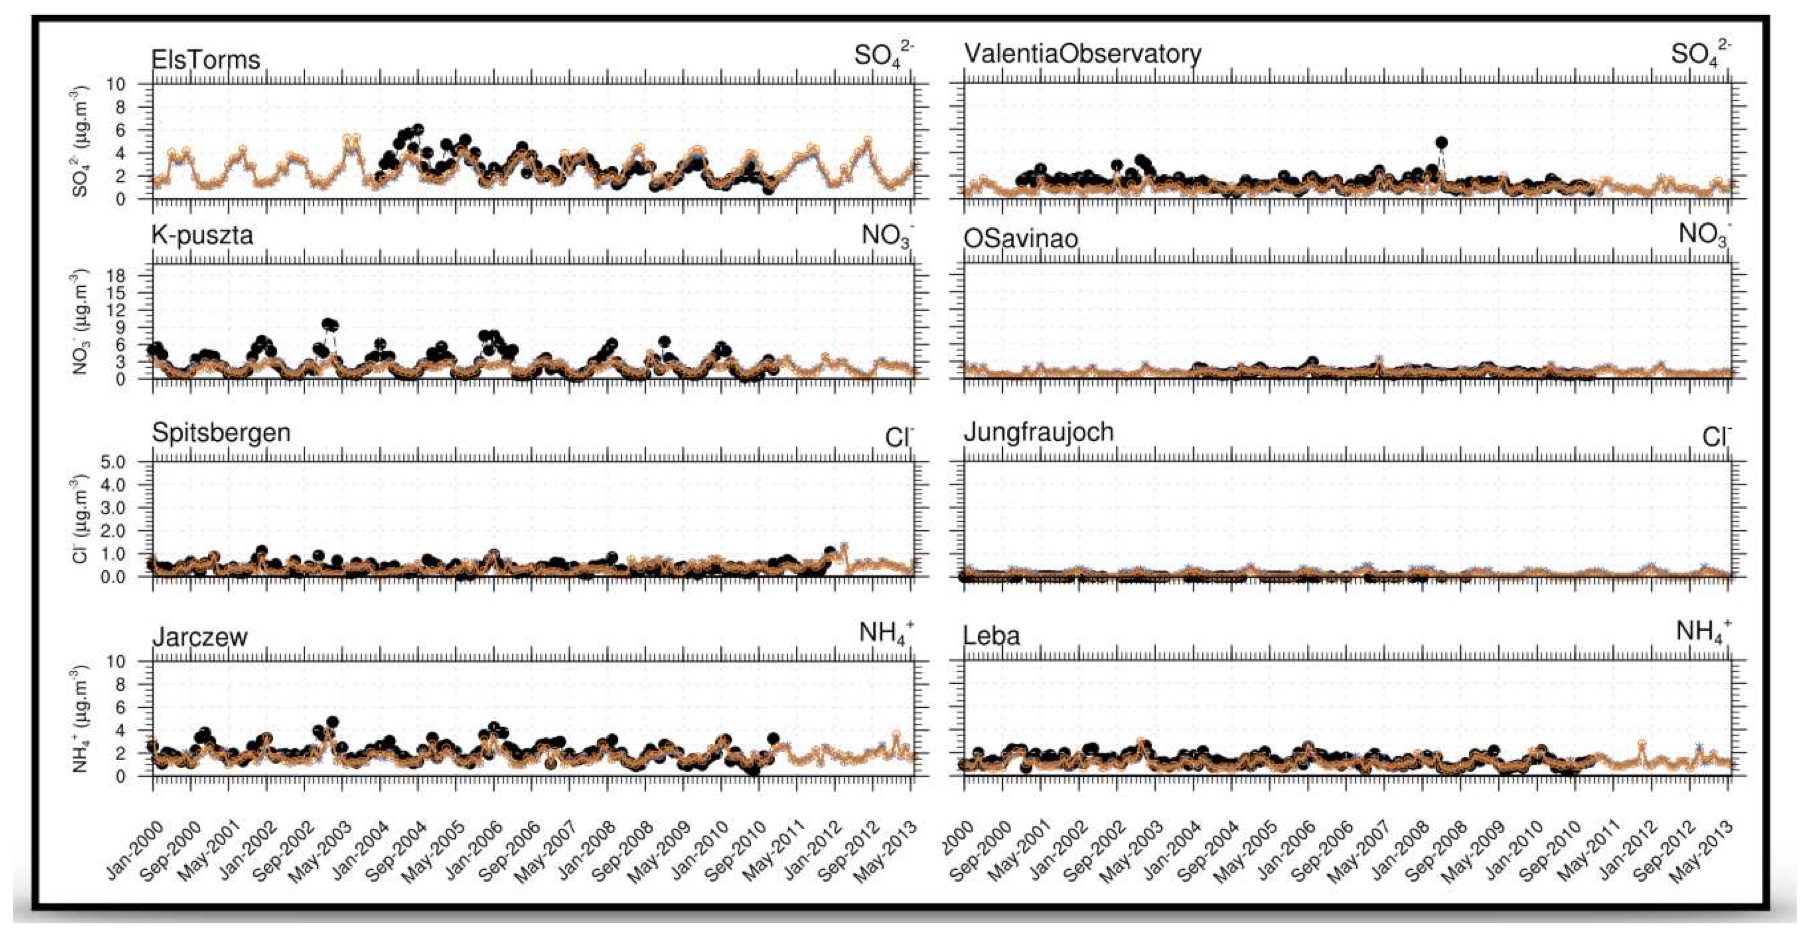
Figure 3 : Complementing Fig.1-2. Lumped aerosol concentrations (liquids+solids) of the EMAC simulations based on two gas-liquid-solid partitioning schemes: ISORROPIA II (blue line), EQSAM4clim (orange line) and EMEP observations of major anions sulphate (SO42-), nitrate (NO3-), chloride (Cl-) and the cation ammonium (NH4+).
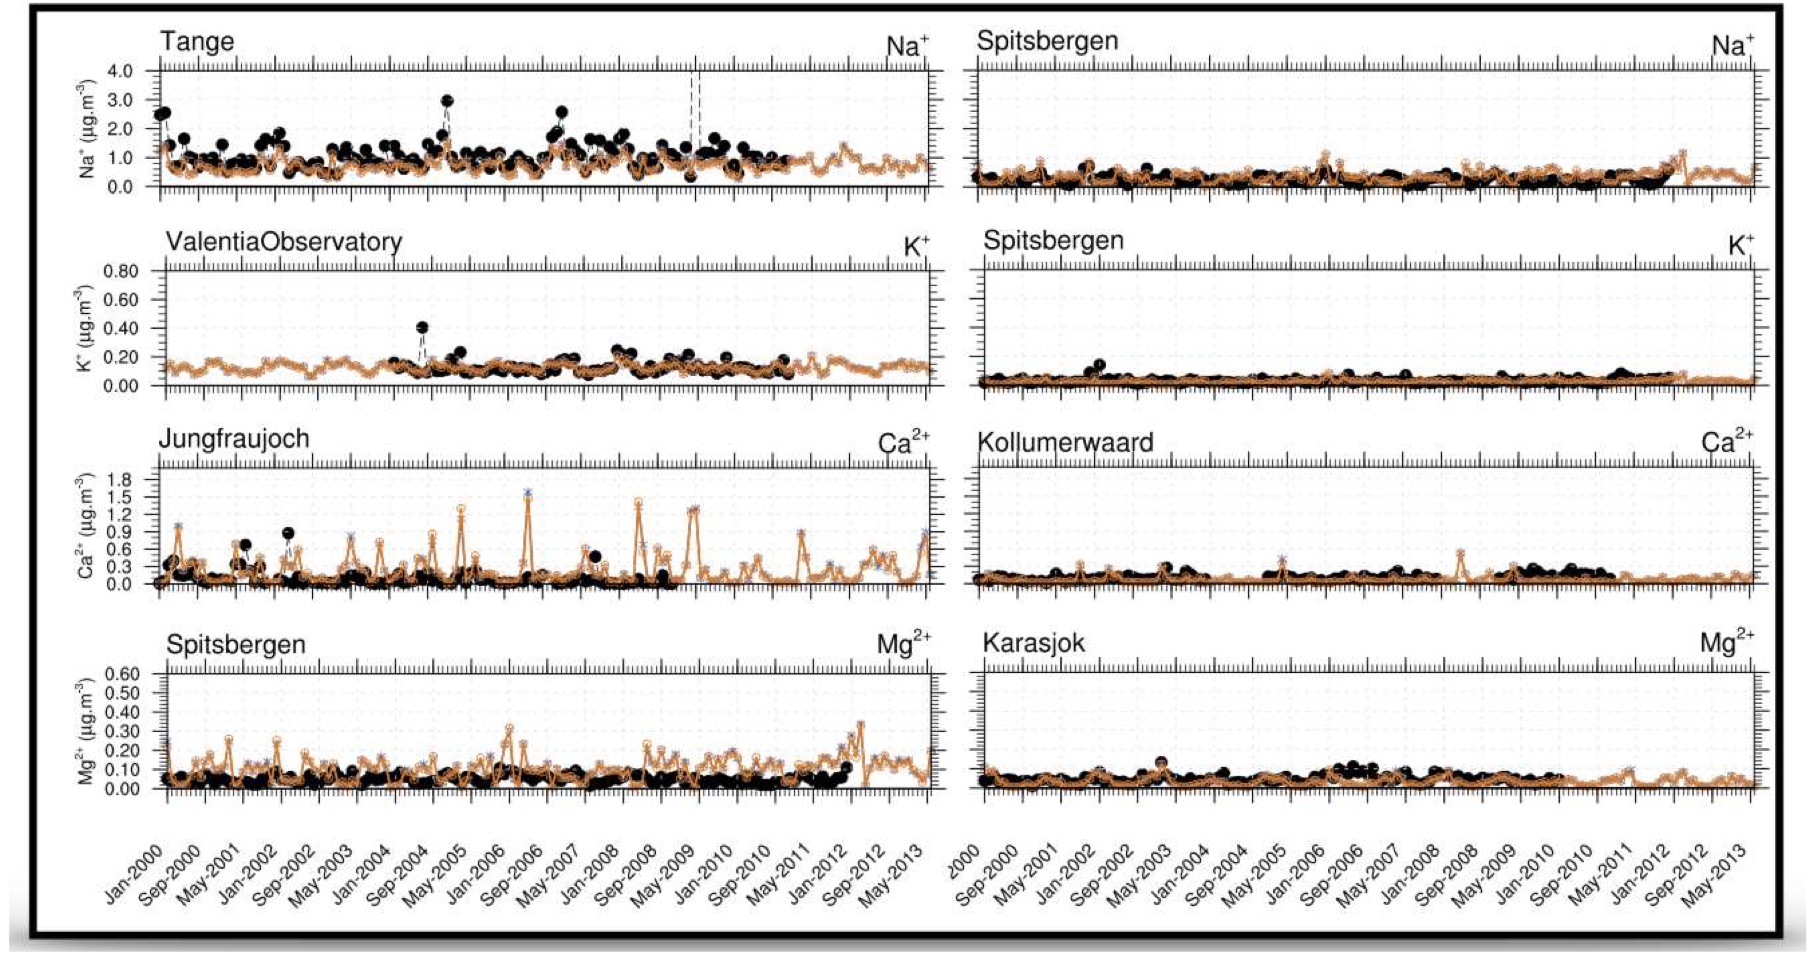
Figure 4 : Complementing Fig.1-3. Major mineral cations: sodium (Na+), potassium (K+), calcium (Ca2+) and magnesium (Mg2+); each species is compared with two different station observations (left and right columns, black lines); EMAC simulations are based on two distinct different gas-liquid-solid partitioning schemes: ISORROPIA II (blue line), EQSAM4clim (orange line).
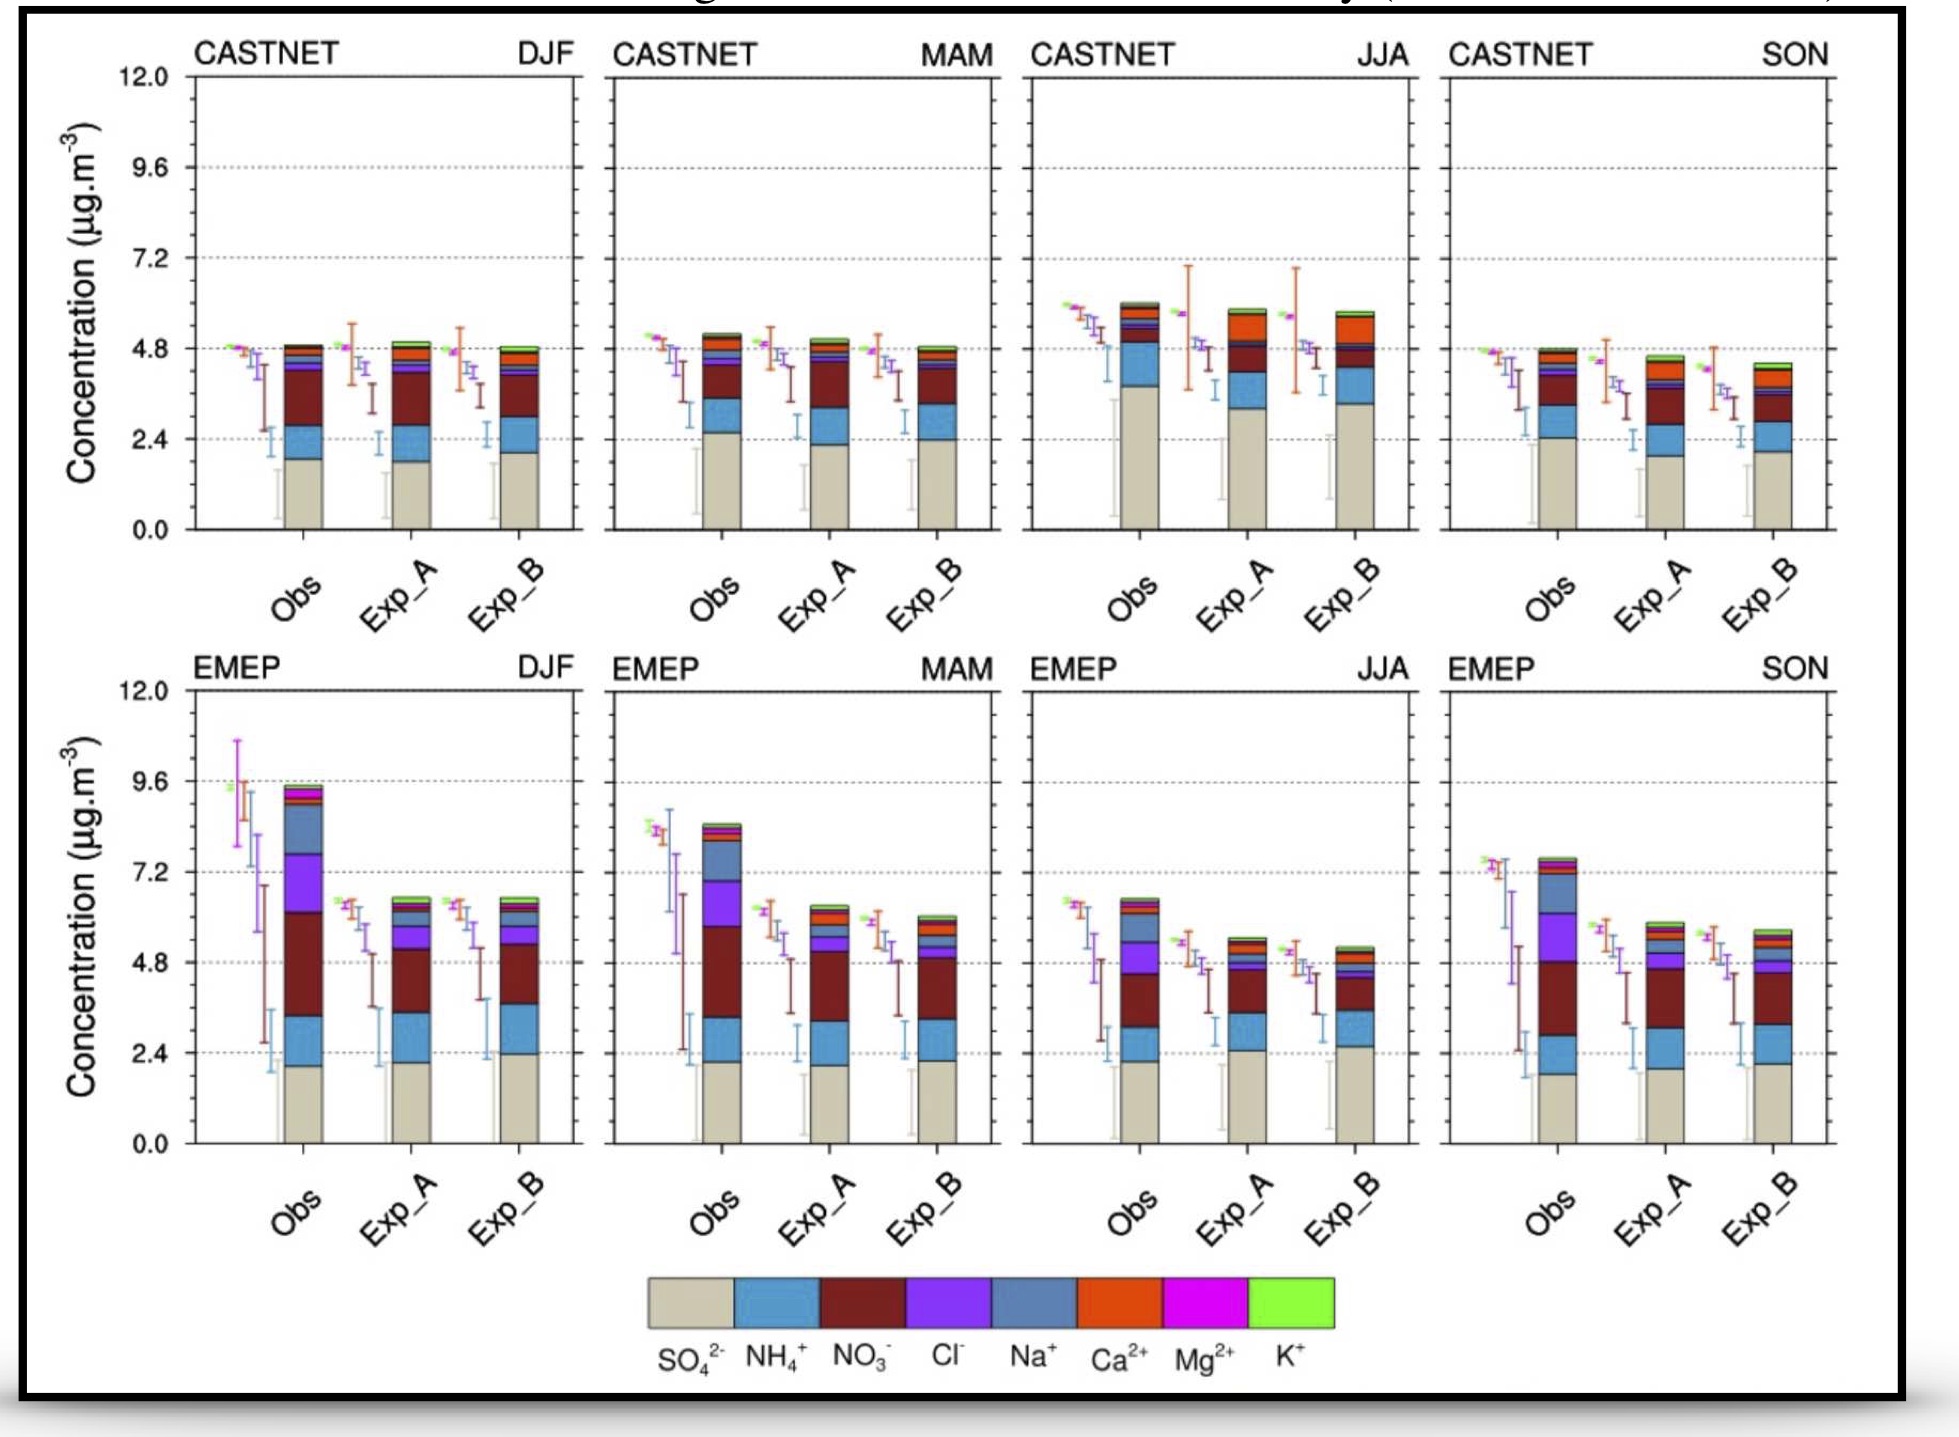
Figure 5 : Complementing Fig.1-4. Longterm seasonal evaluation (2000-2013) of the EMAC aerosol concentrations and composition (sulfate, ammonium, nitrate, sodium, chloride, calcium, potassium and magnesium) over Europe (EMEP) and United States (CASTNET). EMAC simulations based on two gas-liquid-solid partitioning schemes: ISORROPIA II (Exp A), EQSAM4clim (Exp B).
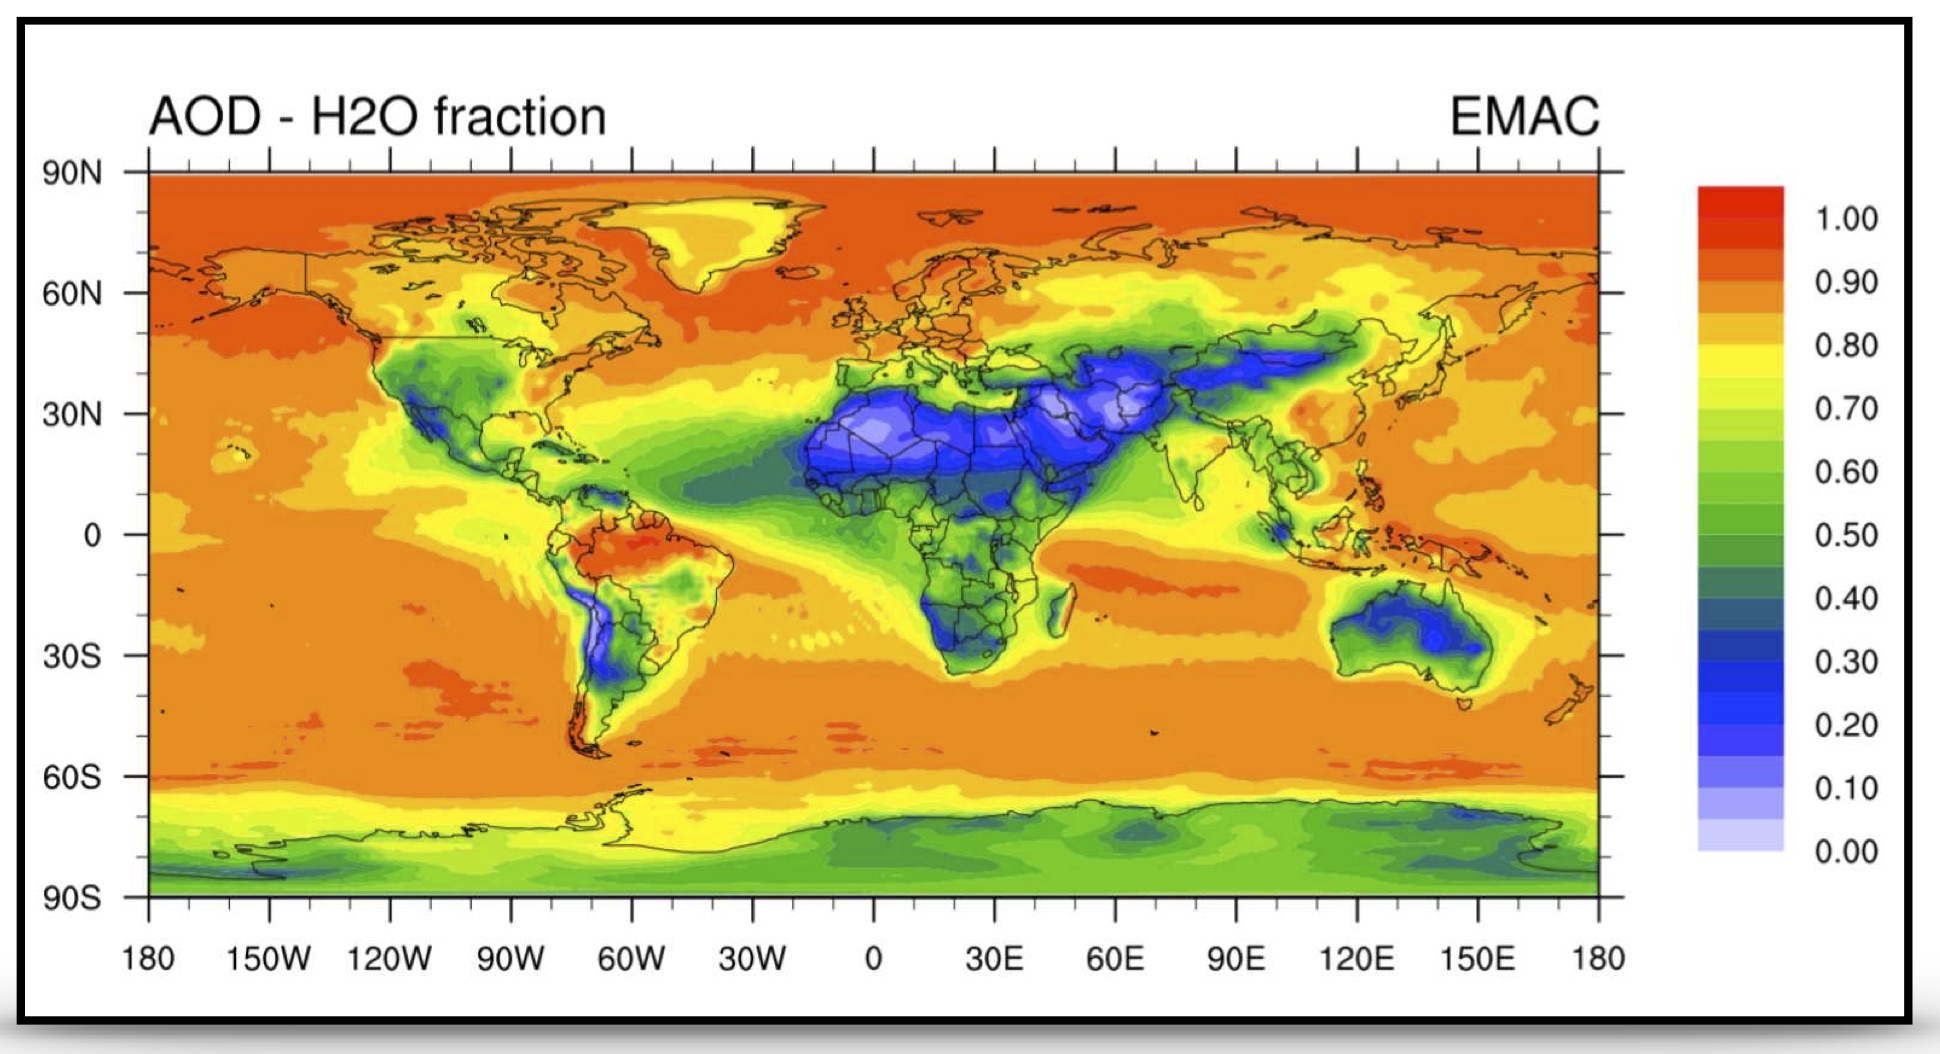
Figure 6 : Complementing Fig.1-5. Spacial (2000-2013) EMAC aerosol water mass AOD fraction that corresponds to the AOD distribution shown in Figure 7.
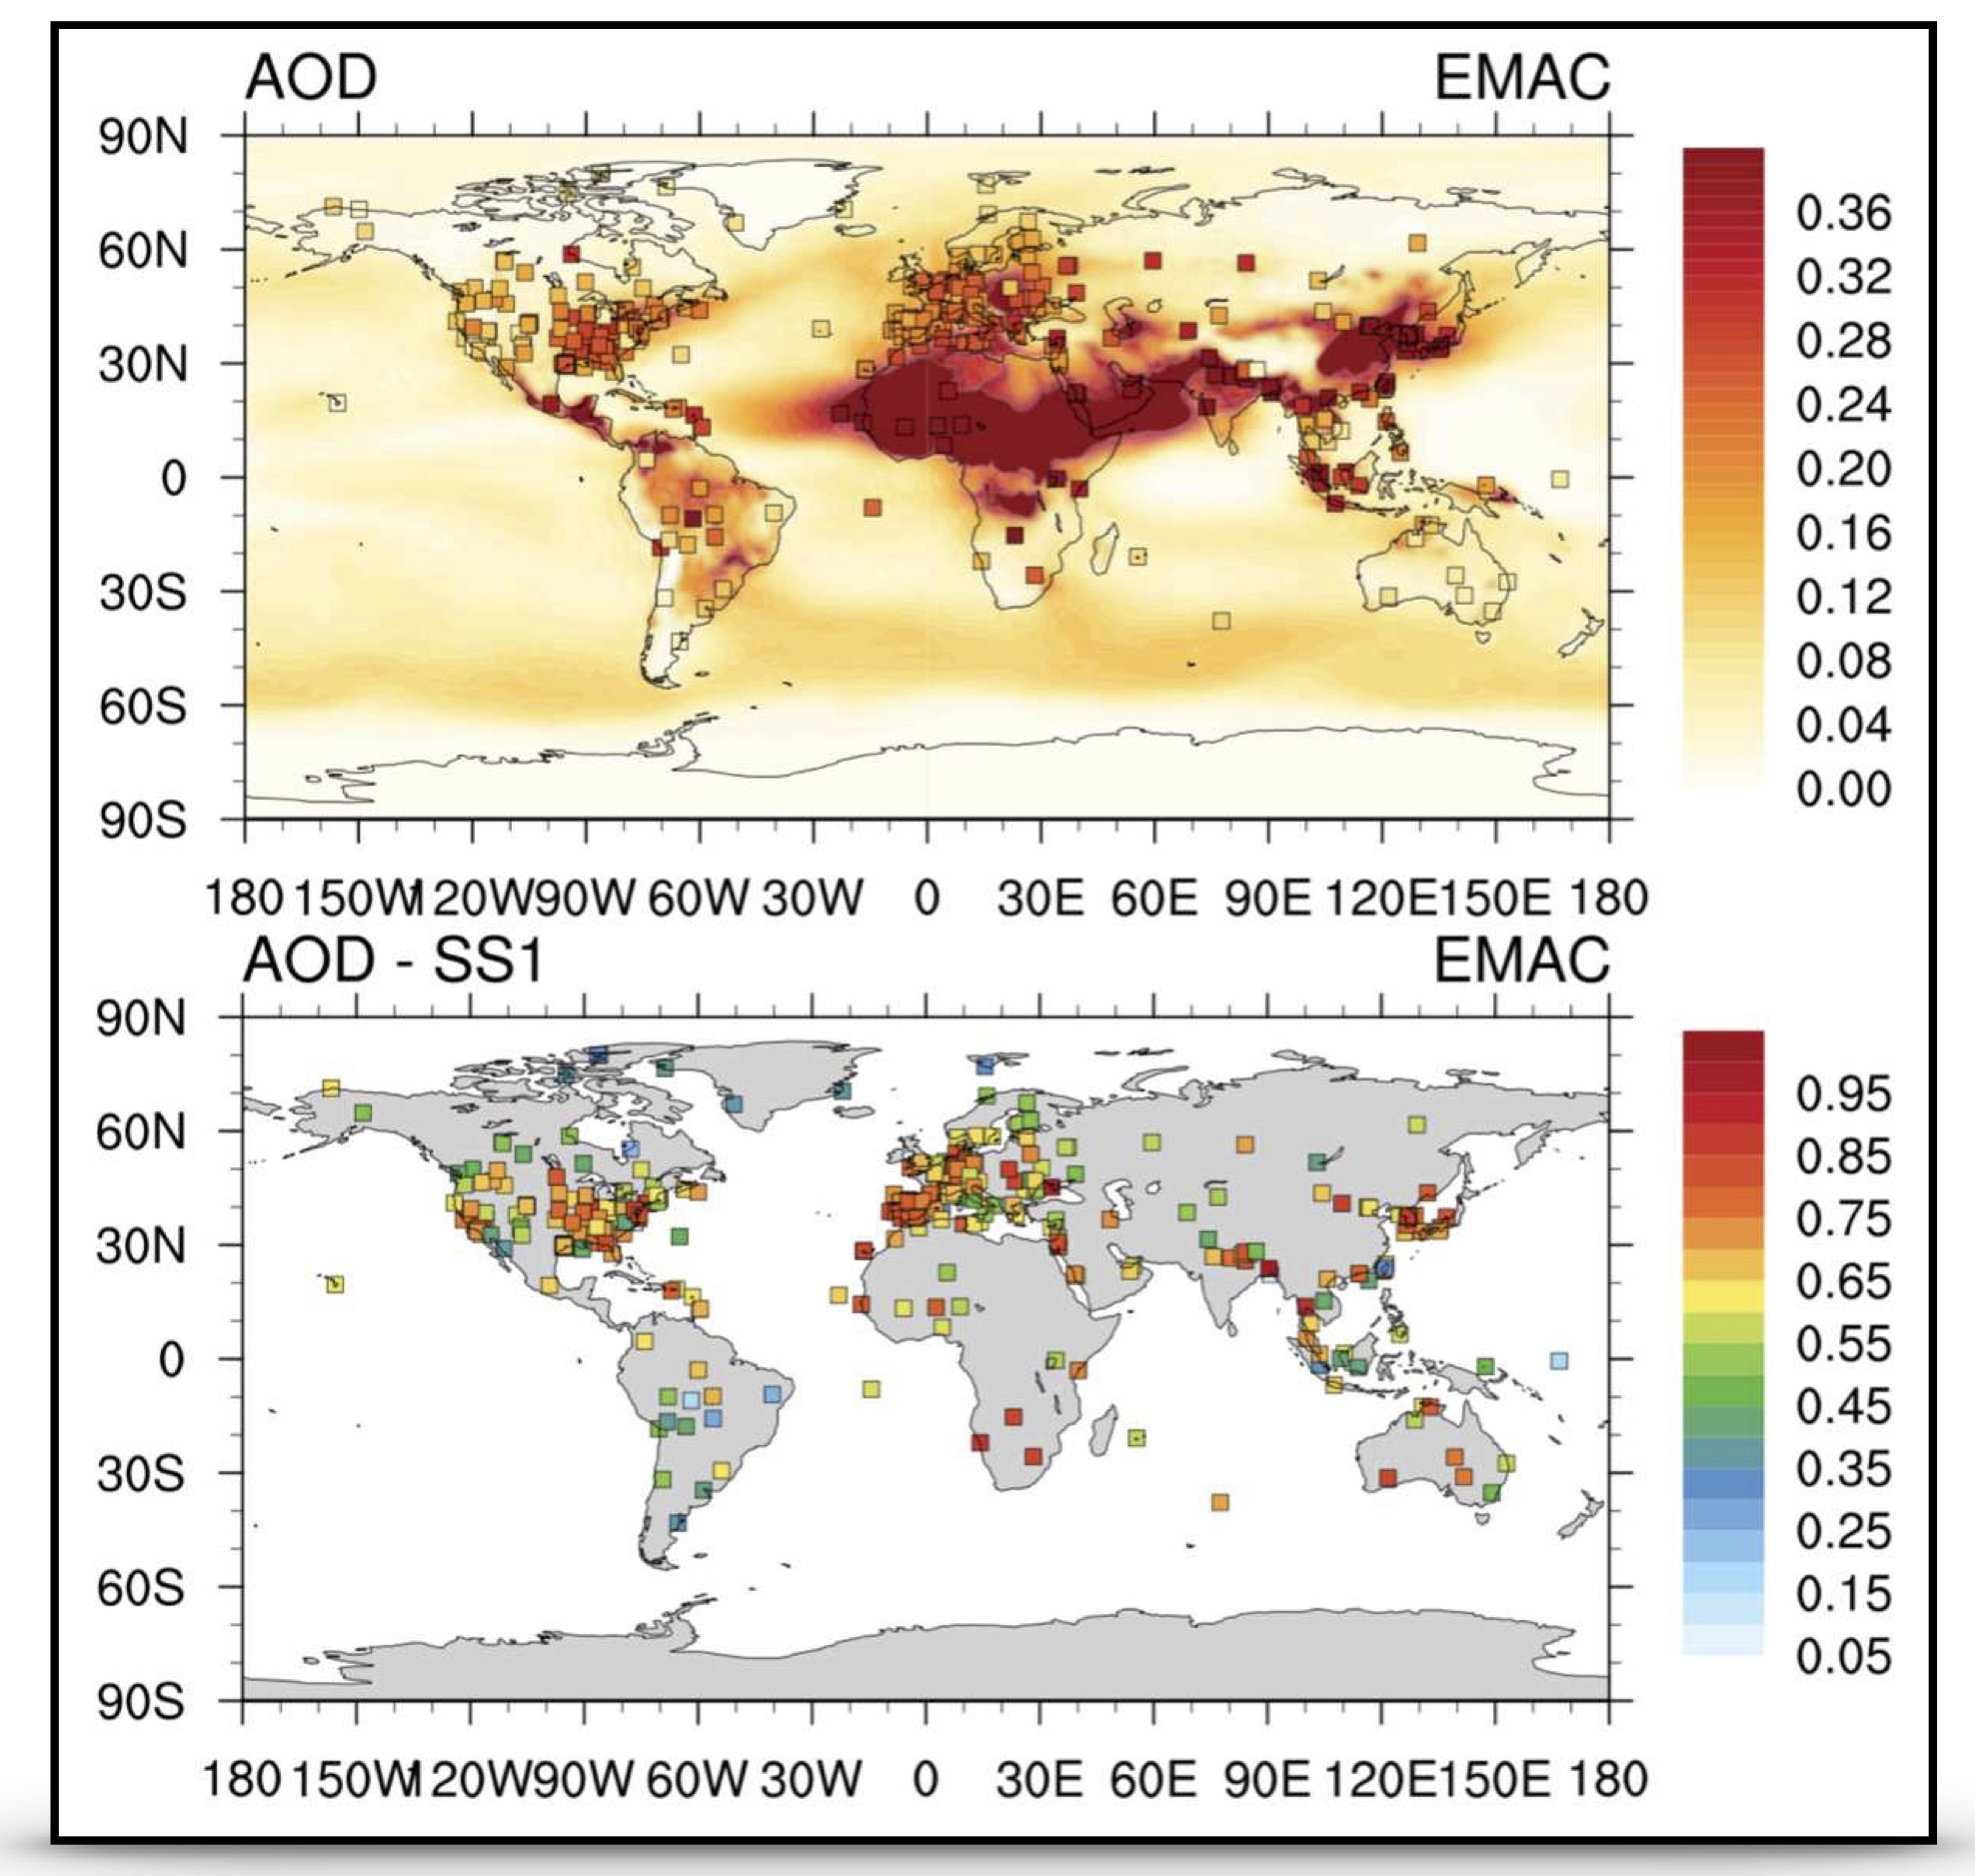
Figure 7 : Complementing Fig.1-6. Top: Spacial (2000-2013) AOD distribution of the EMAC results with overlaid AERONET station observations (squares). Bottom: Corresponding skill score (EMEP vs. CASTNET observations).
-
EMAC aerosol composition data
Short Summary
Figures 5-6 shows an example model output that on which Fig. 1-4 are based, i.e., Modal aerosol concentrations time series of EMAC at the AERONET station Sede Boker. Figure 5 shows the aerosol species include the total particulate matter (PM), the major cations sodium (Na+), potassium (K+), and magnesium (Mg2+), bulk organic (OC) and black carbon (BC), the aerosol precursor gases ammonia (NH3), hydrochloric acid (HCl), nitric acid (HNO3), sulphuric acid (H2SO4) and the aerosol optical depth (AOD), while Fig. 6 shows the additional properties aerosol number concentration (AERNUMB), aerosol water (H2O), bulk sea salt (SS), bulk mineral dust (DU), and the lumped (liquid+solid) aerosol compounds sulphate (SO22-), calcium (Ca2+), bi-sulphate (HSO-), ammonium (NH+), nitrate (NO-), chloride (Cl-), and the aerosol optical depth (AOD).
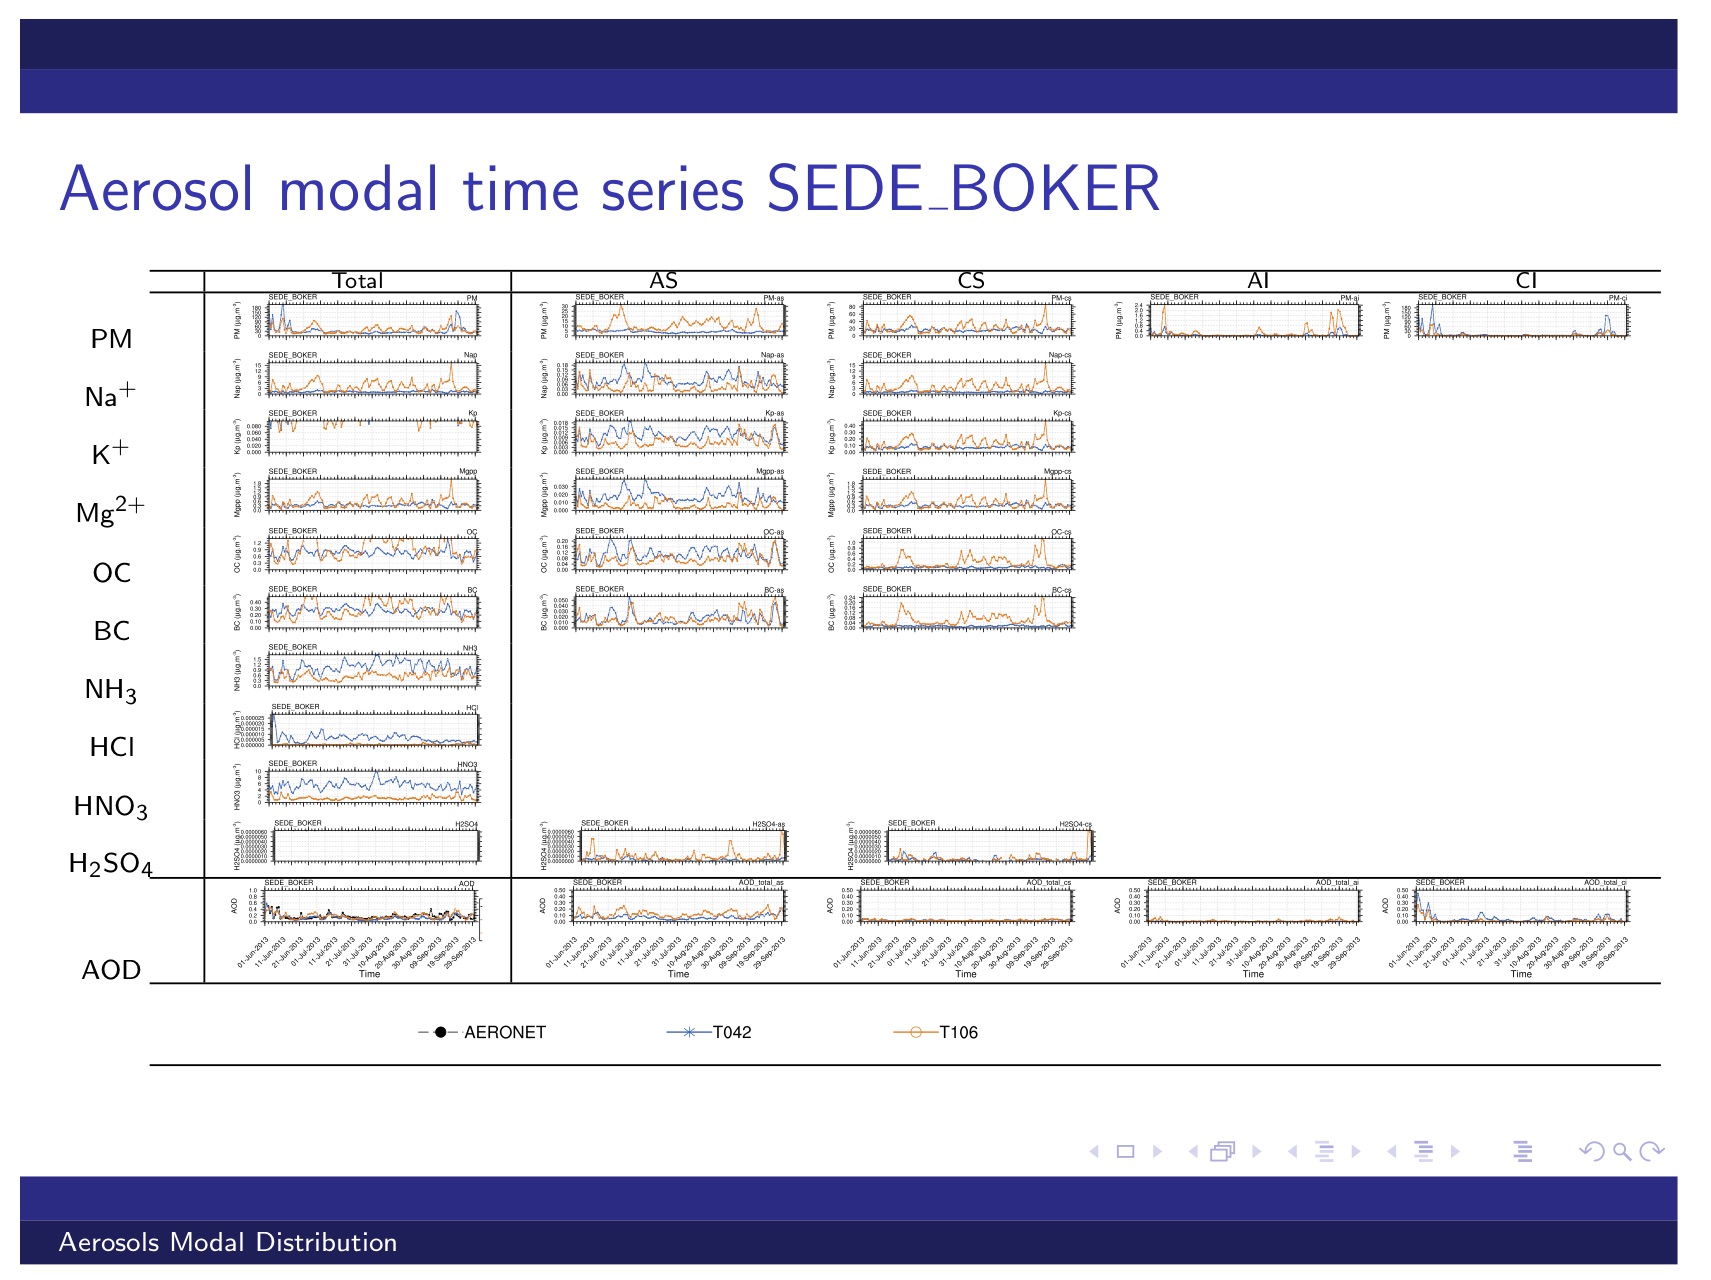
Figure 5 : Example data: Modal aerosol concentrations time series of EMAC at the AERONET station Sede Boker.
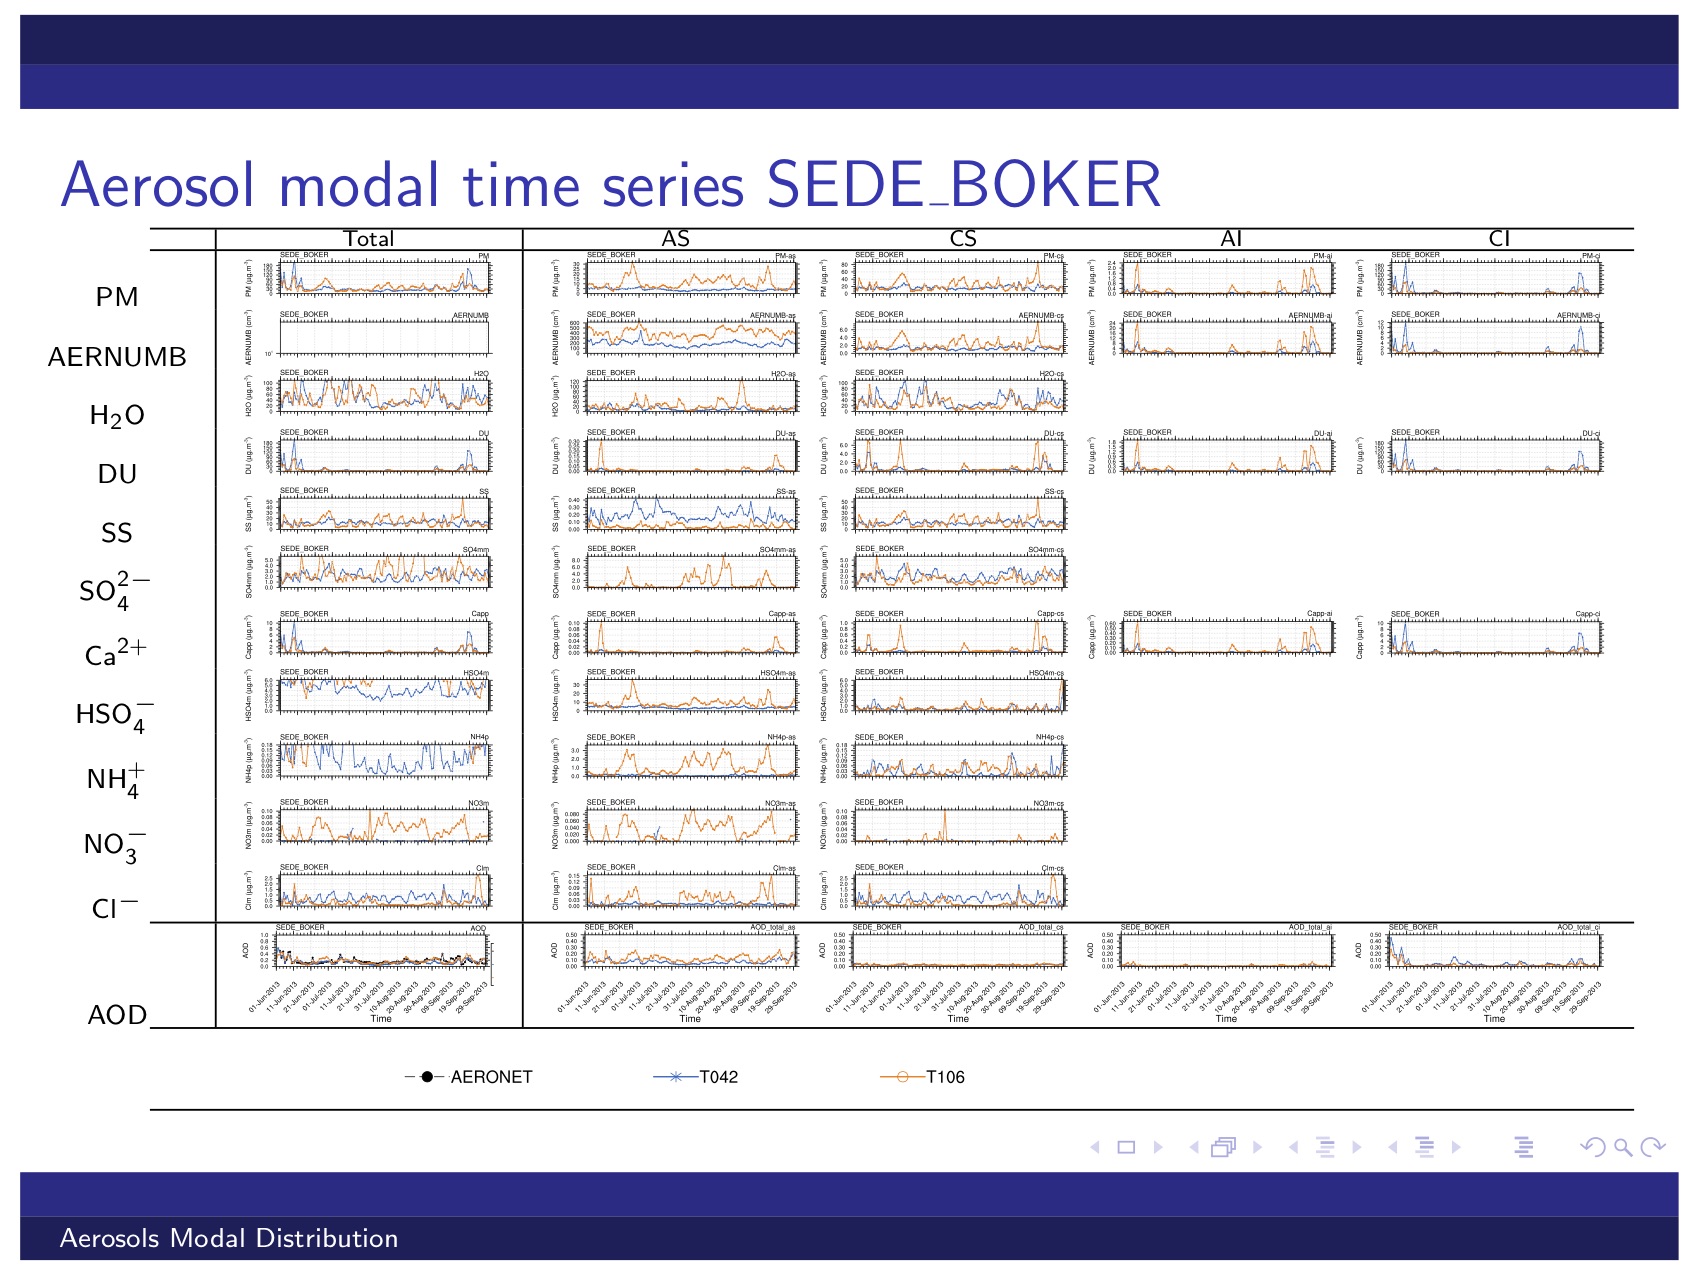
Figure 6 : Example data: Figure 5 continued (see text).
-
Evaluation toolkit & technique
Short Summary
Our results are prepared with our model and observational data evaluation and analysis toolkit (by Abdelkader and Metzger, publication in progress).
Figure 7 shows a flow chart of our evaluation toolkit which we have used to validate the PMAp2 AOD products (Metzger, et al., 2016b). Our evaluation generally starts with the pre-processor, which is basically based on the netCDF Operator (nco), making some basic operations such as concatenating files, calculating averages (daily, monthly, seasonal or annual averages) of the satellites and model output, regardless to the actual temporal resolution. In addition, the calculation of extra variables, needed for the evaluation analysis, such as total sulfate (sulfate + bi-sulfate), are performed. The observational data, e.g., various products of satellite and ground-based observational networks, exemplarily shown in Figure 2, are prepared for quality check and converted from different types of time units to the standard time unit. The procedure depends on the type of the observation, from which each set of observation has it own scripts that convert the data to Climate and Forecasts metadata conventions (CF) standards. This procedure largely improves and facilitates a standardized comparison of the model results and observations on the temporal scale.
The interpolation module is the core of the evaluation framework in which all required interpolations are performed, including unit check and conversion. This is the most CPU intensive module and therefore runs in process based parallelization, so that multiple observational data sets can be handled in parallel. The interpolation includes the linear interpolation in time, bi-linear in horizontal space and linear-log pressure in the vertical direction. Alternatively, the user can e.g. select the closest grid point to the observation station instead of interpolation. The output of the module are intermediate files in the netCDF format following the CF standards, which contains the model and the observational data in the same space and time coordinate such that the data could be also further visualized and analyzed by third party software.
The analysis and plotting module uses the intermediate files to create, e.g., the daily, monthly and annual averages, and to allow additional time series and trend analysis of both model results and observations. Furthermore, a punch of highly customized plotting routines were developed to produce the figures in a publication quality standard such as Taylor, scatter, time series, trajectory analysis and other plots.
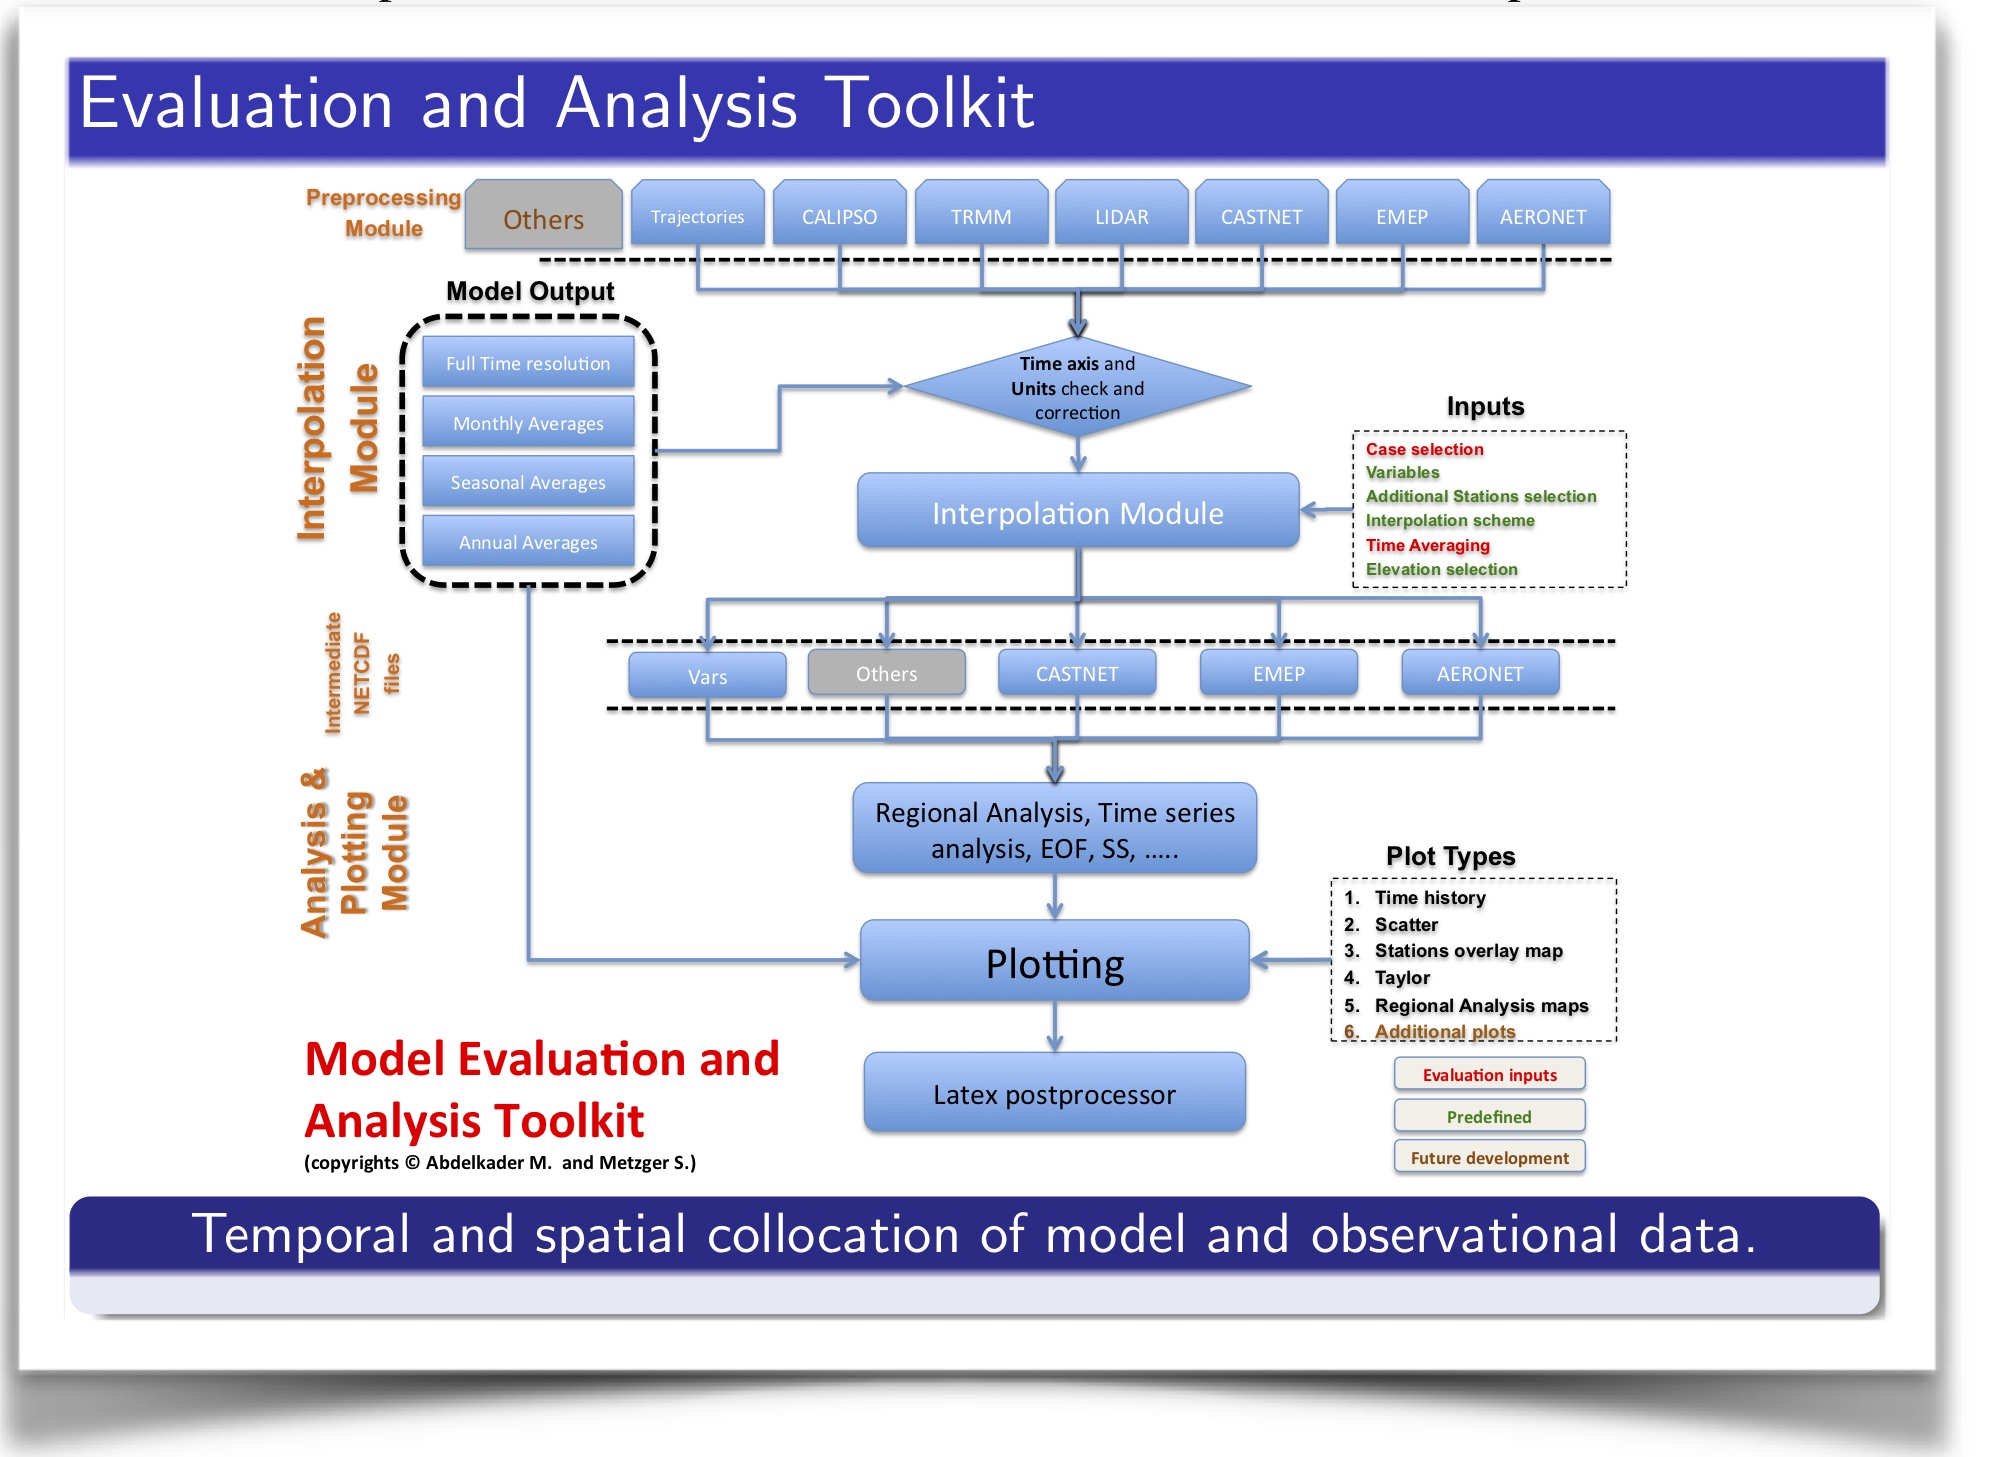
Figure 7 : Evaluation toolkit. See Sec. 2.1 of our EUMETSAT Report ITT 15/210839.
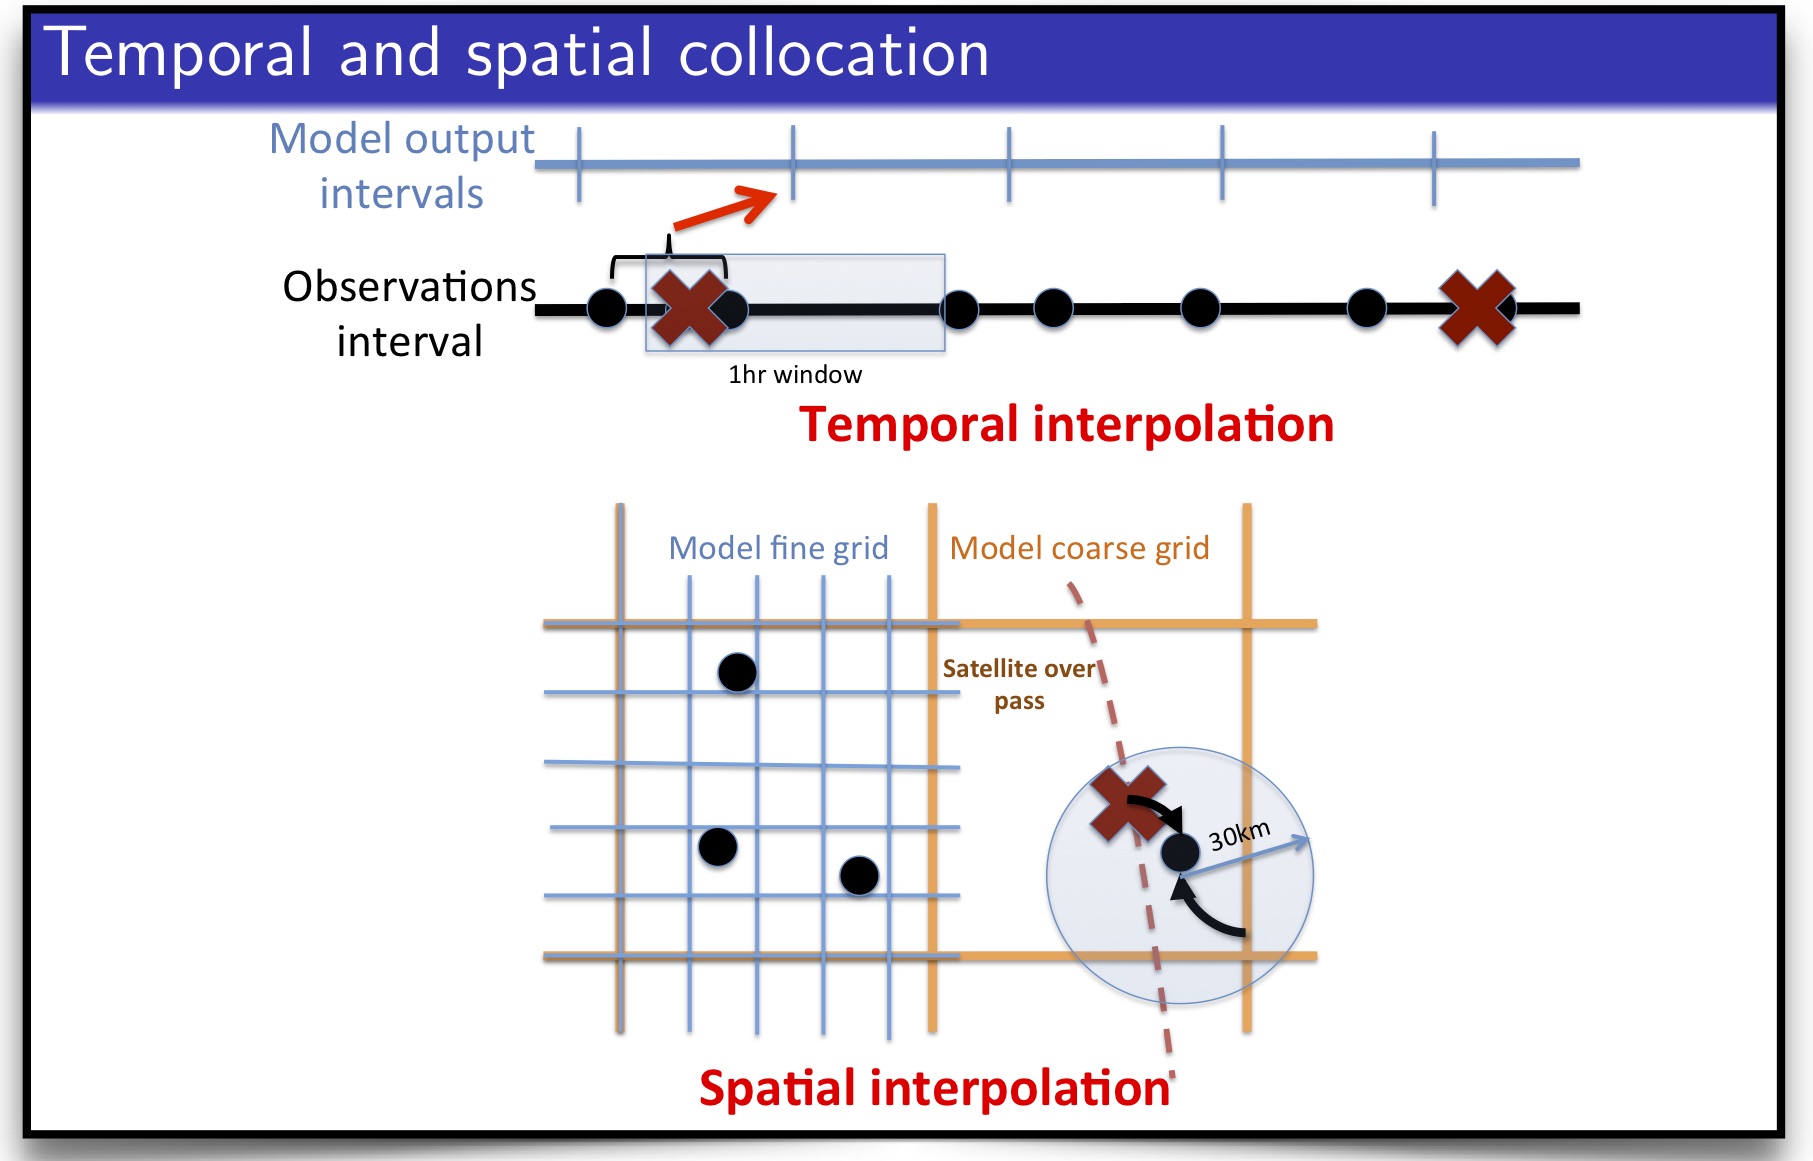
Figure 8 : Schematic representation of the interpolation scheme used in the evaluation analysis to compare the different satellite products with the AERONET station data and the model results.
-
Air pollution modeling
ITM 2018 Presentation:
36th International Technical Meeting on Air Pollution Modelling and its Application,
14 - 18 May 2018, The Lord Elgin Hotel, Ottawa, Canada,
(In conjunction with the Annual WMO-GURME Meeting).
Comparing the ISORROPIA and EQSAM Aerosol Thermodynamic Options in CAMx. Bonyoung Koo [1], Swen Metzger [2], Chris Emery [1], Gary Wilson [1] & Greg Yarwood [1]; [1] Ramboll, 773 San Marin Dr., Suite 2115, Novato, CA 94945, USA, [2] ResearchConcepts io GmbH, Freiburg im Breisgau, Germany.
Short Summary A computationally efficient thermodynamic equilibrium model, EQSAM4clim was implemented in CAMx and compared with ISORROPIA. Both models’ results are sufficiently similar that either could reasonably be selected. Advantages of using EQSAM are that it runs faster (in our test, EQSAM reduced the overall CAMx runtime by 4% (January) to 7% (July)) relative to the overall CPU usage of CAMx. Noteworthy, EQSAM4clim is free of numerical artifacts.
Download PDF: Poster (923 KB).

Copyright © 2016-2024, Eco-Serve.de - All rights reserved.
Eco-Serve is powered by ResearchConcepts.io,
Freiburg i. Br., Germany.
Amtsgericht Freiburg HRB 717519.
